Full Report
Fit — Amdocs Limited (DOX)
Outside the framework's universe (U2 not met); contested: P2
Amdocs sits outside the framework's universe. The scale line (U2) is not met — USD market capitalization is ~$6.18B against the $10B minimum, unanimous across all four jurors — and under the framework's rules a universe miss ends the screen before any pillar can qualify it. Confidence is high: two model families agreed, the trial was order-stable, and load-bearing spreads were at most 0.15. No exclusion was hit and the name-mask probe raised no prior-driven-risk flag. One criterion is contested — P2 (FCF consistency) — where the two families split met vs cannot-determine.
Universe and exclusions — unsoftened
Amdocs clears the listing test but fails the scale test, and the scale test is decisive.
U2 (scale) — not met (unanimous, both families). At the $55.28 close on 2026-07-30 the 111.746M ordinary shares outstanding are worth $6.18B, roughly $3.82B below the $10B line. The shortfall is drawdown-driven rather than structural: at the 2025-06-12 peak of $94.08 the same share count implied ~$10.5B, so on a pre-dislocation basis the company sat at or above the line. But the framework measures the figure today, and today it is below. This is the gate the tally applied — U2 not_met → out_of_universe — and nothing downstream overrides it.
U1 (listing) — met (unanimous). Amdocs' ordinary shares have traded directly on the Nasdaq Global Select Market since December 20, 2013 [1]; it is a Guernsey-incorporated foreign private issuer filing Form 20-F [2] — a Channel Islands (European) domicile with a US primary listing, read as a directly-listed foreign private issuer rather than an ADR.
No exclusion was triggered. X1 (auto OEM) — Amdocs is a single-segment provider of BSS/OSS, digital and cloud software and managed services to communications and media companies, explicitly described as a "systems integration" vendor, with no automobile-manufacturing activity [3]; not a hit. X4 (consensus-saturated story) — DOX trades at ~1.36x FY2025 sales after a ~47% drawdown with only ~3% forward revenue growth expected, the antithesis of an extreme-multiple, saturated-growth narrative; not a hit. X2 (promotion pattern) and X3 (structural decline) are evidential and are treated in the pillar ledger below; both resolved not_met. S1 (China dependence) is a sensitivity flag only and was not raised: geography is disclosed as North America (65.8%), Europe (15.6%) and Rest of World (18.6%), China is not a reported geography, and no development facility sits in China [4].
Note the exclusions and S1 show a label split — three jurors recorded not_met and the fourth recorded not_hit — but that is wording, not a factual dispute: every juror found the exclusion did not apply.
Pattern match
On surface features this has the shape of the framework's FCF-dislocation setup: a dated adverse catalyst (two guidance-day drops), a ~47% peak-to-trough drawdown, an adjusted FCF yield within ~125 bps of the balance-sheet bar, and an inverted signature where earnings rose while the multiple compressed. That is the closest resemblance among the constructive setups.
It qualifies as none of the four patterns, because the disqualification happens at the universe screen — a sub-$10B name is out before pattern qualification is even reached. Two pillar checks would independently block it as well: the year-10 durability gate (P1) is not met, and today's adjusted yield (P3c) sits below its bar. The resemblance is real but does not convert into a fit. This is framing only; it does not alter the tally's verdict.
The pillar ledger
Source: deterministic fit tally (per-criterion aggregate verdicts, trimmed-mean probabilities, and spreads).
Year-10 durability (P1) — the gate that would have decided a universe-qualified name
Not met (unanimous, both families; p_year10 0.61, spread 0.06). The revenue disqualifier is false — FY2025 GAAP revenue fell 9.4% to $4,532.9M, but that is one year, not the three consecutive high-single-digit declines the disqualifier requires (consecutive_decline_years = 1). The durability case is genuine: ~66% of revenue is recurring managed services renewing near 100%, remaining performance obligations are ~$6.4B, the model is asset-light, and consensus models FCF rising from $651.6M (FY2026) to $940.2M (FY2029) [5]. What puts the year-10 leg in genuine doubt is that organic growth is only ~1.5% (about half of the ~3% headline is inorganic), the core CSP end market is mature, SaaS/cloud challengers attack the bespoke-integration model — CSG Systems' FY2025 10-K names Amdocs directly as a competitor [6] — the three-year GenAI growth engine remains undelivered, and ~46% of revenue sits in two carriers (AT&T 25.9%, T-Mobile 19.9%) with T-Mobile a named FY2026 headwind [7]. The gate resolves on genuine doubt about "very high conviction," and the doubt is present.
Strongest surviving counter-fact: a lower year-10 FCF is hard to picture — FCF has held $530–698M through the disruption, consensus models it rising, and the ~−3.3%/yr buyback keeps compounding per-share value even at ~3% top-line growth. Full treatment: The Carrier's Backbone.
FCF consistency (P2) — the contested criterion
Contested (claude family met; codex family cannot_determine). Raw free cash flow held a positive $452.6M–$715.4M band across FY2020–FY2025 with no negative year, a ~$610.0M mean and ~15% coefficient of variation [8]. The split is about which metric: the spec's exact P2 measure is a rolling five-year average of adjusted FCF, and that window closes only from FY2024 (the corpus reaches acquisition history back to FY2020), leaving just two fully-windowed adjusted years — FY2024 $389.4M and FY2025 $447.9M, both positive and rising. The claude jurors read the six-year raw-FCF stability plus the two rising adjusted years as met; the codex jurors held that a two-point fragment cannot establish the five-year rolling metric and returned cannot_determine. Neither reading disputes a number; they disagree on whether the available window suffices. This is framing — P2 is not a gate — and it does not change the universe verdict.
Strongest surviving counter-fact: the raw-FCF stability is partly a capital-intensity story — capex roughly halved from ~$227M (FY2022) to ~$104M (FY2025) while equity-based compensation more than doubled to $104.9M [9], so the SBC-adjusted picture is less flattering than the raw line. Full treatment: The Carrier's Backbone.
Dislocation + yield (P3)
P3a identifiable event — met (unanimous). Two dated adverse prints anchor the fall. The Q4 FY2025 release (Nov 11, 2025) initiated a soft Fiscal-2026 outlook of only 1.0%–5.0% constant-currency growth after the 9.4% reported FY2025 revenue decline [10]; the stock fell ~7.9% the next session on ~6.9x median volume. The Q1 FY2026 print (Feb 3, 2026) fell ~8.6% even though revenue rose 4.1% YoY, a T-Mobile multi-year renewal was signed, and guidance was reiterated [11]. Strongest surviving counter-fact: the −47% drawdown spans 378 days across three legs, and the steepest (June 2026 to the $49.87 trough) carried no dated company catalyst — corpus news links it only to sector-wide AI-restructuring sentiment, so the setup reads as much like an orderly multi-leg de-rating as a single fear event. Full treatment: The Engineered Decline.
P3b capitulation — met (unanimous; reference line, not a gate). The capitulation gauge measured a 3.11x volume multiple against the 2x reference line, with single-day event spikes of ~6.9x (2025-11-12) and ~5.3x (2026-02-03). The caveat: the sustained-volume peak sat in early-March 2026 after the February leg, not at the June trough, whose down day ran only ~3.1x — so there was no classic single-day blow-off at the low.
P3c yield vs bar — not met (unanimous). At FY2025 year-end net debt was $325.0M against ~$927M EBITDA (0.35x), a fortress class that sets the bar at 8.5% [12]. Hand-computed adjusted FCF yield (FCF − SBC − 5yr-avg acquisitions) is 7.25% current and 7.48% on a three-year average — short of the bar by ~125 and ~102 bps [13]. The deterministic feature returned unknown (the feed lacked FY2025 debt/cash and the SBC/acquisition add-backs), so both the class and the yield were rebuilt from the primary cash-flow and balance-sheet statements. Strongest surviving counter-fact: on the raw (unadjusted) definition the trailing FCF yield is 10.4% and clears the bar comfortably — it is only the ~$197M SBC-plus-acquisition haircut that pulls Amdocs under the line; and by Q2 FY2026 borrowings rose to ~$900M against ~$214M cash (net debt ~0.7x), shifting the class toward moderate (10% bar) and widening the gap [14]. Full treatment: Priced for Decline.
P3d forward path — met (unanimous; p_forward_bar 0.615, spread 0.02). Applying the same haircut to consensus FCF, adjusted forward yield runs 7.35% (FY2026), 8.74% (FY2027) and 10.94% (FY2028) — crossing the 8.5% bar in FY2027 on the current depressed price, no mean reversion required [15]. Strongest surviving counter-fact: the crossing is mechanical on a static price — it rests on consensus FCF rising to $737M (FY2027) off a year in which revenue fell 9.4%, and any upward re-rating (the whole point of a dislocation entry) would compress the yield back below the bar. Under the Q2 FY2026 moderate class and 10% bar the crossing slips to FY2028. Full treatment: Priced for Decline.
Balance sheet + self-help (P4)
P4a outlast + allocation — met (unanimous). The only funded debt is a single $650.0M Senior Notes issue (2.538% fixed) that does not mature until June 2030, the $800M revolver runs to July 2029 and was undrawn and covenant-compliant at Sept 30, 2025, and investment-grade ratings are intact — so debt service does not compete with repurchases [16]. Strongest surviving counter-fact: headroom is thinning, not solvency — returning more than 100% of FCF drew cash and short-term investments from $514.3M (FY2024) to $325.0M (FY2025) to ~$214M (Mar 2026) and now leans on an $800M commercial-paper program launched March 2026 [17].
P4b repurchase engine — met (unanimous). Buybacks are executed cash (~$490–563M/yr, $2.11B over FY2022–FY2025) that shrank diluted shares 9.6% (123.65M → 111.75M, ~−3.3%/yr); the hard-fail test is negative (share_count_trend.rising = false), and management returned more than 100% of FCF through repurchases and dividends into Q2 FY2026 [18]. Strongest surviving counter-fact: the three most recent vintages were struck at ~$85–90/share against a ~$55 quote, and continued capacity is increasingly commercial-paper-funded rather than covered by current FCF [19].
P4c dividend cover — met (unanimous). The dividend is material to the return case (~3.8% current, ~4.1% on the proposed FY2026 step-up) and well covered: FY2025 dividends declared of $224.4M consumed ~35% of $645.1M FCF, DPS has risen every year and was maintained through COVID, and forward cover on the $710–730M FCF guide is ~3x [20]. Strongest surviving counter-fact: the dividend alone is covered, but it is the junior lever inside a >100%-of-FCF total payout, so the package as a whole is partly balance-sheet-funded. Full treatment: Priced for Decline.
Diagnosis (P5)
Met — leaning temporary (unanimous; p_temporary 0.69, spread 0.06, trial-carried). The probability that the impairment is temporary was produced by an adversarial trial — two opposing cited briefs, three independent judges (0.69 / 0.66 / 0.72) — returning a mean of 0.69 with contested = false and an order-stability gap of 0.0. The signature is inverted: price fell ~41% from its three-year high while FY2025 earnings rose — GAAP diluted EPS +18.8% ($4.25 → $5.05) and non-GAAP EPS +8.5% ($6.44 → $6.99) [21]. The mechanism that "broke" the top line was a deliberate, margin-accretive phase-out of low-margin non-core work (ex-phase-out revenue grew 3.1%), which anniversaries rather than compounds [22], and the company reiterated FY2026 guidance while consensus FCF rises through FY2029.
Strongest surviving counter-fact: the recovering base is a slow-grower — management concedes roughly half of FY2026's ~3% constant-currency growth is inorganic, leaving organic growth near ~1.5% [23] — and T-Mobile (~20% of revenue) re-signed yet is still guided to lower spend because its "spending appetite is lower," showing budgets can fall even where renewals hold [24]. On a DCF-lite at r=10% the market-implied FCF (~$618M) sits inside the permanent band, so the value gap exists only if the impairment is temporary. Full treatment: Priced for Decline.
Instrument context (I1)
Not verifiable (unanimous; facts only, never blocks a pillar). DOX's 30-day mean implied volatility was 49.55% as of 2026-07-30 (AlphaQuery), inside the ~55 acceptable reference line, with a bearish put-over-call skew (put IV 53.30% vs call IV 45.81%) and IV ~20 points above realized volatility. The criterion is not_verifiable because a qualifying long-dated instrument (expiry ≥ 12 months, target ≥ 18) could not be confirmed: the only reachable dated chain (Public.com/Xignite) showed expirations through 2027-01-15 (~5.5 months), while Nasdaq, Yahoo, MarketChameleon and Optionistics were bot-walled or timed out. I1 drives only the watchlist overlay, which does not apply to an out-of-universe name. Full treatment: Priced for Decline.
What a 3x-in-3-years would require
The tally records: "Re-rating math unavailable because the applicable bar or normalized adjusted FCF is missing." The bar, normalized_adjusted_fcf, implied_market_cap_at_bar, and upside_to_bar_pct fields are all null, because the deterministic adjusted-FCF-yield feature was not_computable (no SBC add-back in the feed, cash acquisitions read $0, and no complete five-year acquisition window). The framework's price-at-bar-yield test cannot be rendered from a canonical feature.
The closest available arithmetic is the DCF-lite the Damage Math pillar carried (r = 10%, consensus and FY2025 actual FCF):
Source: derived from reported financials (FY2025 Consolidated Statements of Cash Flows) and consensus FCF [25].
A 3x in three years from the $6.18B market cap implies roughly $18.5B. Even the temporary-diagnosis capitalization tops out near $6.5–8.1B, and the permanent case ($5.3–5.8B) is below today's market cap — so on the modeled paths the framework's 3x target is not reached on any scenario. It would require FCF to compound far faster than the temporary case assumes and consensus to concede a full re-acceleration of the ~1.5% organic line. For base-rate context on how deep this drawdown is and how such episodes recover, see Priced for Decline. This is the framework's target test stated as arithmetic, not a recommendation.
Contested and undetermined
Contested: P2 (FCF consistency). The two families split on which metric governs. Both readings agree the six-year raw-FCF series has no negative year (~$610M mean, ~15% CV) and that the two fully-windowed adjusted years (FY2024 $389.4M, FY2025 $447.9M) are positive and rising. They disagree on sufficiency: the claude jurors resolved met on that evidence; the codex jurors resolved cannot_determine because the spec's rolling five-year adjusted-FCF average cannot be formed from only two computable adjusted years. It is a window-length disagreement, not a factual dispute, and P2 is not a gate.
Nothing resolved to cannot-determine at the criterion level, so there is no single missing datapoint that flipped a verdict. One criterion, I1, is not_verifiable — IV is established from a dated source but a directly read long-dated option chain could not be pulled (vendor bot-walls); I1 never blocks a pillar.
Provenance
| Field | Value |
|---|---|
| Jury seats | a = claude, b = claude, c = codex, d = codex; masked = claude |
| Model families | claude, codex |
| Universe agreement | U2 unanimous not_met across both families |
| Load-bearing spreads | ≤ 0.15 (P1 0.06; P3d 0.02; P5 0.06) |
| Trial order-stability | temporary-first mean 0.69; permanent-first mean 0.69; gap 0.00 |
| Name-mask probe | max probability gap 0.035; no gate criteria flipped → prior_driven_risk = false |
| Skeptics | 11 survived, 5 weakened, 0 refuted, 2 unverifiable, 17 triaged-only |
Source: deterministic fit tally (provenance block) and the adversarial trial tally.
The verdict was pressed and held: two independent model families reached the same universe call, and re-ordering the trial's reading sequence moved the diagnosis probability by 0.00. The name-mask probe — re-running the jury with the company's identity hidden — flipped no gate verdict and moved probabilities by at most 0.035, so the call is driven by the evidence, not by a prior about the name. The single label split (three not_met / one not_hit on the exclusions) is wording, not disagreement.
The falsifier ledger
These are the standing what-would-change-this conditions carried in the tally. The first five are the framework's generic templates (each a direction on a level already underwritten); the remainder are Amdocs-specific, most embedding their own threshold and window (a fiscal-quarter deadline, a margin or FCF floor, a customer event). Several near-duplicate each other because both the trial and the pillar briefs contributed conditions.
Data gaps
What the run could not answer, from the tally's list:
- Adjusted-FCF features are not_computable. The cash-flow feed carries no SBC field and reads acquisitions_cash as $0 despite transcript-confirmed deals, so
adjusted_fcf,adjusted_fcf_yield,fcf_stability,yield_baselineandbalance_sheet_classall returned not_computable. Every adjusted-FCF figure, the yield-vs-bar test, and the fortress classification were rebuilt by hand from the FY2025 (p.136) and FY2022 (p.91) cash-flow statements. - The P2 rolling five-year adjusted-FCF average cannot be formed. Only the FY2021–FY2025 filings are in the corpus, so the trailing-5-year acquisition window closes only from FY2024 — two adjusted years versus the five a rolling average needs; the ~15% CV reported is on the raw six-year series, a proxy.
- China exposure cannot be sized. Geography is disclosed only as North America / Europe / Rest of World, so any China component is bounded by the $844.3M Rest-of-World line, not measured.
- No matched before/after consensus revision series. The near-term "hit" is inferred from reiterated guidance plus a rising consensus FCF path; a point-in-time consensus-cut magnitude around the drawdown could not be sourced from a primary page.
- No dated catalyst for the steepest leg. The June-2026 leg to the $49.87 trough has no company filing/release in the corpus — web research surfaced only sector-wide AI-disruption sentiment.
- Instrument granularity. A qualifying long-dated LEAPS with adequate open interest could not be confirmed (vendor option-chain pages bot-walled); IV itself is dated and verifiable.
- Insider transaction direction is unobservable. As a foreign private issuer Amdocs is exempt from Section 16, so the X2 second prong rests on the 2.0% standing ownership stake [26] with no transaction feed.
- U2 share count. Market cap uses FY2025 period-end shares (111.746M); if current shares differ the ~$6.18B figure shifts modestly, not enough to reach the $10B line.
Checked and unremarkable
All eight synthesis scouts returned load_bearing — none was routine or empty — so their findings feed the pillars above rather than this list: accounting/cash-quality, business-economics, capital-allocation, competition-moat, history/track-record, industry, people/governance, and valuation-expectations.
Playbook version
Playbook fcf-dislocation, version 4 (spec playbook/fit-spec, version 2), as frozen for this run.
The Company at a Glance
When you pay a phone bill, someone's software decided what to charge you, applied the promotion you signed up for, provisioned the new line onto the network, and opened the ticket when your service dropped. For roughly 400 of the world's communications, entertainment and media companies — including some of the largest telecom operators alive, among them AT&T, T-Mobile, Verizon, Vodafone, América Móvil, Bell Canada, Telstra and Singtel — that someone is Amdocs [1]. Amdocs is the plumbing behind the phone company: not a brand a consumer ever sees, but the system the operator cannot run a day without.
FY2025 Revenue ($M)
Customers (approx.)
FY2025 Free Cash Flow ($M)
Market Value ($M)
Sources: revenue from the FY2025 20-F Consolidated Statements of Operations [2]; customer count from Item 4 Business Overview [3]; free cash flow and market value (30 July 2026) from reported financials.
A few structural facts frame everything that follows. Amdocs is a four-decade specialist that has done one thing — software and services for communications carriers — for its entire corporate life, and it still reports as a single operating segment, disclosing revenue only by geography rather than by product or service line [4]. As a foreign private issuer it files a Form 20-F rather than a 10-K, keeps its books in U.S. dollars under U.S. GAAP, and runs a fiscal year that ends on 30 September [5]. Its holding company is incorporated in Guernsey, in the Channel Islands, with a registered office in St. Peter Port, and its shares trade on the Nasdaq Global Select Market under the ticker DOX [6]. The single-segment disclosure matters more than it sounds: it means the whole "how does this business earn its keep" question has to be reconstructed from what management chooses to say about its mix, because the filings hand the reader one blended profit-and-loss statement and nothing beneath it.
The Software That Runs a Phone Company
The industry Amdocs sells into has a name investors rarely hear: BSS/OSS. Business Support Systems (BSS) are the commercial brain of a carrier — billing, charging, customer relationship management, order management: the systems that turn a rate plan into an invoice and a signup into an active account. Operations Support Systems (OSS) are the network-facing half — provisioning a service onto the network, monitoring it, and fixing it when it breaks. A pure-play rival, Cerillion, describes its own product in exactly these terms — "mission-critical software for billing, charging and customer relationship management, primarily to the telecoms sector" [7]. The word that recurs across every vendor's paperwork is mission-critical: these are not systems a carrier swaps out casually, because a billing error at national scale is a regulatory and revenue event, not an inconvenience.
Two things flow from that. The first is where the money pools. Amdocs frames its own opportunity not as selling shrink-wrapped software but as being one of the "vendors of information technology software products and providers of managed services and end-to-end systems integration" for the industry [8]. The revenue concentrates in multi-year engagements — building and then running a carrier's core systems — rather than in one-time license sales. The second is the barrier to entry, which is the same thing as the value on offer: decades of accumulated, specifications-intensive know-how about how to integrate and operate systems at the scale of a national carrier. That is why the incumbent position is durable, and also why it is slow: the moat is operational entrenchment, not a patent, and entrenchment does not grow quickly.
The scale gap between Amdocs and a specialist rival makes the point concretely. Cerillion, a well-regarded pure-play in the same billing-and-CRM niche, serves roughly 70 customers [9] on about £45 million of annual revenue [10]. Amdocs serves roughly 400 customers on $4.53 billion. The specialists are real and capable; they operate at a fraction of the scale at which Amdocs runs the systems of tier-one operators.
A Large Market, Four Kinds of Rival
Amdocs sizes its addressable market at "nearly $60 billion" and describes itself as having "significant room to grow" within it [11]. That figure is company-stated — no independent third-party market-size series sits in the record to check it against — but against FY2025 revenue of $4.53 billion it implies Amdocs holds a notional seven-to-eight percent of its own stated market. In a business defined by scale and entrenchment, that makes Amdocs the scale leader of a large, fragmented field rather than a monopolist of a small one.
The competitive field is not one adversary but four, and the 20-F is unusually candid in naming them. Amdocs says its landscape "continues to be highly competitive" and sorts its rivals into four camps that press on it simultaneously [12].
Source: FY2025 20-F, Competition section, competitor names as disclosed [13].
Read down that table and the structural pressure is visible: Amdocs is attacked from four directions at once — by full-suite software peers head-on, by horizontal IT-services firms reaching down into its territory, by network-equipment makers reaching up from theirs, and by nimble specialists carving off one function at a time. Several of the integrators it names as rivals it also names as partners, which is characteristic of this market: the same firm can be a competitor on one carrier and a subcontractor on the next. Whether that four-way pressure is eroding the franchise or merely surrounding it is a question the durability chapter takes up (Moat or Melting Ice); the point here is only that competition is structural and comes from every side, not from a single named threat.
Where the Money Pools
Beneath the single blended profit-and-loss statement, management points investors to two numbers that describe how the revenue is actually shaped. The first is managed services — the contracts where Amdocs runs a carrier's systems on an ongoing basis rather than building and handing them over. Management reports this book at roughly $759 million a quarter, close to two-thirds of revenue, renewing at "close to ~100%" [14]. That recurring, near-fully-renewing base is why the company's cash flows are as visible as they are; it is also why growth is hard, because a book that renews near 100% by definition does not grow much on its own.
The second is cloud, the one part of the mix that reliably compounds. Amdocs reported "another year of double-digit cloud growth, now over ~30% of revenue" in FY2025 [15]. Cloud is the growth engine bolted onto a slow-growing recurring base — the mix shift that has to do the top line's work, because the base beneath it barely moves.
Geographically, the money pools in one place. North America accounted for 65.8% of FY2025 revenue, Europe 15.6%, and the rest of the world 18.6% [16], and the 20-F states plainly that a "substantial majority" of revenue comes from North American customers [17].
Source: FY2025 20-F, Geographic Information note [18].
The regulatory frame is worth naming because it is not what a first glance would suggest. Amdocs's own customers are heavily regulated carriers, but the direct regulatory burden on Amdocs itself is mostly data privacy — as a processor of subscriber data, it is exposed to regimes such as the EU's GDPR, whose fines can reach up to 4% of global annual revenue [19]. It is a software vendor's regulatory profile, not a carrier's.
Concentrated by Design
The most important thing to understand about the shape of Amdocs's revenue is how few customers make it up. AT&T, historically the largest, was 25.9% of FY2025 revenue; T-Mobile, the next largest, was 19.9%. Together those two carriers are 46% of the company. The ten largest customers together are roughly 70% [20].
Source: FY2025 20-F, Customers section; "Next 8" derived as the top-ten aggregate (~70%) less AT and T and T-Mobile [21].
This is the fact that makes Amdocs behave the way it does. Because managed-services contracts renew near 100%, that concentration normally reads as stability — the same handful of carriers, embedded, year after year. But it works in both directions: with two customers at 46% of the total, a single carrier's decision to spend less can move the entire company's top line further than the double-digit cloud engine can offset. Visibility and single-name fragility come from the very same source. The concentration is a structural feature of selling systems that only a few operators are large enough to need; the durability chapter weighs which edge of it is sharper right now (Moat or Melting Ice).
Why Now
Two dated facts put this company in front of an investor today. Reported revenue fell 9.4% in FY2025, from $5.00 billion to $4.53 billion — the sharpest drop in the company's recent record and a sign change from the 2.4% growth of the year before. And the stock sits about 41% below its three-year high as of late July 2026.
Source: reported revenue, FY2023–FY2025 20-Fs, Consolidated Statements of Operations [22].
Set that decline against what the company says about its own runway, and the tension that animates the whole report comes into view. Here is a scale leader claiming a nearly $60 billion market with "significant room to grow," holding only seven-to-eight percent of it — and its realized revenue went backwards 9.4% while forward consensus calls for just 3.4% growth. Large stated headroom; negligible realized capture. Whether that gap is the top line ceding ground or something more deliberate is precisely what the next act decodes (The Decline That Wasn't) — and the short answer, which that chapter earns in full, is that most of the 9.4% was self-inflicted.
That decode is the first move in a longer argument. Amdocs is a deeply entrenched telecom BSS/OSS incumbent whose headline 9.4% FY2025 revenue drop was a self-inflicted low-margin phase-out, not a demand collapse: it converts nearly all of its earnings to cash and returns more than all of it through buybacks that shrink the share count about 3.8% a year, yet the market has re-rated the stock roughly 44% to about eight times forward earnings — a cash compounder priced for decline, where the live question is whether a mature carrier market and the AI-driven unbundling of its bespoke-integration model justify the discount. Each chapter that follows takes up one piece of that sentence: the decline decode and the cash it throws off, the durability of the moat, the credibility of the people steering it, and the arithmetic of the price. The world the reader now holds — a scale leader in a large, slow, tier-one-concentrated software market, where a single carrier's budget can move everything — is the ground all of it stands on.
The Engineered Decline
Amdocs closed fiscal 2025 with revenue of $4,532.9 million, down $472.1 million, or 9.4%, from the prior year [1]. For a company whose top line had climbed 6.8% and then 2.4% in the two prior years, a near-double-digit contraction reads as a demand shock. It was not. Most of that fall was a decision management made about which work to keep — and once the decision is separated out, the underlying business grew, the margin stepped up because of the subtraction, and nearly every dollar of profit still arrived as cash. The translation from the headline to the reality is the whole of this chapter.
Reported Revenue Growth
Underlying (ex phase-out, cc)
GAAP Operating Margin
Cash Flow / Net Income
Sources: FY2025 20-F MD and A, revenue and operating results [2] [3]; Consolidated Statements of Cash Flows [4].
The $600 million that left on purpose
During the quarter ended December 31, 2024, Amdocs phased out several low-margin, non-core business activities. Those activities had produced roughly $600 million of revenue in fiscal 2024 — about $150 million a quarter — and by the first quarter of fiscal 2025 they had substantially ceased [5]. Because that revenue sat in the fiscal 2024 base and was absent from fiscal 2025, it mechanically subtracts about twelve points from the reported growth rate. Strip it out, along with an immaterial foreign-currency drag, and revenue grew 3.1%; revenue from the ten largest customers, on the same basis, grew 3.6% [6].
The sign change is real in the reported number and illusory in the business. Growth ran at 2.4% in fiscal 2024, printed at negative 9.4% in fiscal 2025, and would have printed near positive 3% on a like-for-like basis — the trajectory bent by a portfolio choice, not by customers leaving.
Non-core activities (~$600M) sat in the FY2024 base and were substantially gone by Q1 FY2025; the FY2025 all-core bar ($4,533M) is higher than the FY2024 core portion ($4,405M). Source: FY2025 20-F MD and A, phase-out footnote [7].
The distinction matters because "revenue fell 9.4%" and "the retained business grew 3%" call for opposite reactions, and only one of them is what happened. The retained base is the managed-services and cloud business established earlier; what left was standalone, low-margin activity the company chose to stop performing rather than sell.
The market underneath the number
A self-directed cut looks very different from ceded ground, and the peer shelf is the way to tell them apart: if the whole industry were contracting, rivals would say so. They do not — but they draw a careful line between the end market and the software spending inside it. Ericsson, which sells network equipment to the same carriers, told investors its own growth "will come in areas outside of our traditional CSP markets" such as enterprise and mission-critical networks, and that its planning assumptions for the radio-access market "remain flat over the longer term" [8]. The communications carriers — Amdocs's customers — are a mature, capex-disciplined end market, and an independent peer confirms it.
The transformation and BSS/OSS software budget within that mature market is a different line, and there it was rising. Cerillion, a pure-play billing and charging vendor to telecoms, reported new orders up 25% in its fiscal 2025 [9]. Tech Mahindra, an IT-services integrator, reported that "the communications vertical grew 4.7% year-on-year during the quarter" [10]. Two rivals in two different competitive categories, both growing their telecom software books in the same window Amdocs's reported top line fell — which places the burden of Amdocs's decline on its own portfolio decision, not on a vanishing market. It leaves open, but does not answer here, the harder question of whether Amdocs's roughly 3% underlying pace is keeping up with that rising demand or quietly trailing it.
A margin step built by subtraction
The phase-out did something to margins that a demand shock never would: it lifted them. The activities that left were low-margin, so cost of revenue fell faster than revenue — down 13.5% to $2,811.3 million, taking cost of revenue from 64.9% of sales to 62.0% [11]. Gross margin, essentially flat near 35% for three years, jumped to 38.0%.
Source: derived from reported revenue and cost of revenue, FY2022–FY2025 20-Fs [12].
Operating income tells the same story and adds a caution about which number is being quoted. Reported GAAP operating income rose 16.4% to $731.7 million, and GAAP operating margin went from 12.6% to 16.1% [13]. A widely circulated version of the operating margin reads 17.9% — a figure that adds back the year's $80.5 million of restructuring charges, and so sits about 180 basis points above the statutory 16.1%. Both are defensible; they are not the same number, and a reader comparing Amdocs to a peer needs to know which basis is on the page before the comparison means anything.
Two features bound how far this margin story travels. First, the biggest lever — cutting the low-margin tail — is a one-time reset, and the fiscal 2024 comparison it flatters has now lapped; further expansion has to come from genuine operating leverage or richer mix, not another cleanup. Second, restructuring is treated as a one-off yet has recurred for three consecutive years: $80.5 million in fiscal 2025 followed $131.1 million in fiscal 2024 and actions in fiscal 2023 [14]. A charge that appears every year behaves more like a run-rate cost than an exception, which matters most when it is added back to the headline earnings figure.
Following the earnings into cash
Whatever basis the margin is quoted on, the cash test is cleaner, and Amdocs passes it. Operating cash flow was $749.1 million in fiscal 2025, $724.4 million in fiscal 2024, and $822.6 million in fiscal 2023, against net income attributable to Amdocs of $564.7 million, $493.2 million, and $540.7 million [15] [16]. Cash flow ran at 1.3 to 1.5 times reported earnings every year, and free cash flow — struck after modest capital spending near 2% of revenue — met or exceeded net income in each of the last three years.
Net income attributable to Amdocs from the income statement [17]; operating and free cash flow from the cash-flow statement, free cash flow net of capital expenditure [18].
The mechanism behind that conversion is worth naming, because strong cash flow can be an accrual illusion. Here it is the opposite. As revenue fell, receivables fell with it: the change in accounts receivable was a $79.6 million source of cash in fiscal 2025, where a year earlier a growing book had consumed $104.4 million [19]. Earnings were not running ahead of collections; the balance sheet was releasing cash, not hoarding unbilled revenue. The reporting behind it is long-audited and clean — Ernst and Young has served as auditor since 1988, and signed unqualified opinions on both the fiscal 2025 financial statements and internal control over financial reporting [20]. The one place the auditor flagged genuine estimation risk is where the model actually lives: project revenue is recognized over time on the percentage that incurred labor effort bears to total projected labor effort, and that estimate — the auditor's sole critical audit matter — determines the timing of a large slice of revenue [21].
The translation problem, stated plainly
The clean cash does not mean every headline number can be taken at face value. Amdocs communicates and guides on a non-GAAP figure that sits well above the statutory result. For fiscal 2025, non-GAAP diluted earnings per share was $6.99 against GAAP diluted earnings per share of $5.05 — a gap of $1.94, or about 38% [22] [23].
GAAP and non-GAAP diluted earnings per share, FY2024–FY2025. Source: Q4 FY2025 results release, non-GAAP reconciliation [24].
What bridges the wedge is disclosed: equity-based compensation, amortization of purchased intangibles, restructuring charges, and acquisition-related items, net of tax [25]. Some of these are the standard non-cash adjustments; others are harder to wave off. The single largest add-back is equity-based compensation of $104.9 million — a real cost of paying employees in shares, and one that connects directly to the share count [26]. The recurring restructuring charge reduced GAAP earnings by $0.65 a share in fiscal 2025 and $0.98 in fiscal 2024, and is added back in full each year [27]. The practical rule for the rest of this report is simple: a margin or an earnings figure for Amdocs is not usable until its basis — GAAP or non-GAAP, restructuring-in or restructuring-out — is stated alongside it.
Reassembled, fiscal 2025 is coherent. A portfolio decision cut about $600 million of low-margin revenue, which turned reported growth negative while the retained business grew about 3%; the same subtraction lifted gross and operating margins; and the profit converted to cash as reliably as it always has, verified against a falling receivables balance and a clean audit. The numbers, once translated, describe an intact cash-generating business — which raises the question the next act takes up: how durable is the franchise that produces this cash, when its revenue leans on so few carriers and challengers are attacking the way it delivers.
Moat or Melting Ice
The Engineered Decline left an intact cash machine: a portfolio pruned on purpose, profit still converting to cash, and clean books. What it did not settle is how safe that cash is. A business can convert earnings beautifully for years and still be losing the ground under it. This chapter weighs the franchise on three fronts — the contracts that lock customers in, the two carriers those contracts run through, and the challengers attacking the way Amdocs delivers.
What the lock-in actually is
Amdocs's moat is contractual and operational, not proprietary. The company does not own a patent estate that rivals cannot design around; it owns the running of its customers' live systems. Managed-services arrangements — operating a carrier's billing, charging, CRM, order management and network systems day to day — generated approximately $3.00 billion of revenue in fiscal 2025, up from $2.90 billion, and the 20-F describes them as "substantial, long-term recurring revenue streams and cash flow" [1]. That is roughly two-thirds of the $4.53 billion top line under multi-year operational contracts rather than re-competed product sales.
The forward book carries the same signature. Remaining performance obligations — the contracted, non-cancelable revenue still to be delivered — stood at approximately $6.4 billion at September 30, 2025, the majority expected to convert over the next three years [2]. Management's own near-term gauge, the 12-month backlog, was $4.25 billion at the first quarter of fiscal 2026, up 2.7% year over year [3]. A company whose reported revenue fell 9.4% still entered the year with roughly one year of revenue already committed and a backlog that grew.
The clearest evidence that the moat held while the portfolio shrank sits in the revenue disaggregation. Managed-services revenue rose in each of the last three years even as the total contracted; the entire fiscal-2025 decline landed in the non-recurring "other" line, where the deliberate low-margin phase-out was booked.
Source: FY2025 Annual Report (Form 20-F), Disaggregation of Revenue [4].
The recurring base grew through the decline; the cut fell on the tail. That is the shape of a switching-cost moat working as intended. The switching cost is concrete: to leave, a tier-1 carrier would have to re-platform the mission-critical systems that run its billing and network operations — a multi-year, high-risk migration of live infrastructure, not the lapse of a license. That is why the base renews at close to 100% and why a shrinking-revenue year still carried forward visibility. It is also why the moat's strength and its fragility come from the same place.
The two accounts the moat runs through
The reader already holds the concentration fact from The Carrier's Backbone: AT and T at 25.9% of fiscal-2025 revenue, T-Mobile at 19.9%, and the ten largest customers at roughly 70% [5]. Read one way, that is the switching-cost moat at its deepest — two carriers so embedded that Amdocs runs multiple activities and a large share of their operations under managed services. Read the other way, it is a dependency that no backlog figure can diversify away: the 20-F warns plainly that the loss of a significant customer, or a reduction driven by industry consolidation among its customers, could harm results [6]. The same sentence is the moat and the risk.
Underneath the aggregate, the two accounts are moving in opposite directions. T-Mobile's share of revenue has fallen for three straight years — 23.1% in fiscal 2023, 22.6% in fiscal 2024, 19.9% in fiscal 2025 — while AT and T's has climbed from 23.8% to 25.9% over the same span [7]. The book is not just concentrated; it is concentrating further into a single largest account as the second-largest fades.
Source: FY2025 Annual Report (Form 20-F), Major Customers disclosure [8].
T-Mobile is where the abstraction becomes a dated, quantifiable test. Management built its fiscal-2026 guidance on an explicit assumption of a revenue decline at T-Mobile "due to reduced discretionary spending" [9]. Critically, this is not a lost account: Amdocs signed a new multi-year T-Mobile agreement spanning both ongoing and integration services in the first quarter of fiscal 2026 [10]. The renewal held — and revenue is still guided down. As the CFO put it, the company expects revenue to decline in 2026 because "the spending appetite is lower" at the customer [11].
That is the precise limit of a switching-cost moat. Near-100% renewal keeps the customer; it does not set the customer's budget or the scope it renews at. A carrier can re-sign and still cut discretionary work, and when the carrier is a fifth of revenue, that cut moves the whole top line more than the entire cloud growth engine adds. Lock-in secures the door; it does not fill the room.
The peer growth scoreboard
Set against its peers, Amdocs was the weakest grower of the group in fiscal 2025 — revenue down 9.4% against a peer median of positive 1.9%, a gap of roughly 1,134 basis points, and the widest negative print in the set.
Sources: peer FY2025 filings, as reported; Amdocs pro forma constant-currency growth per FY2025 20-F [12].
This is the anomaly the scoreboard poses, and it does not fully dissolve when the engineered decline is stripped out. The Engineered Decline showed that most of the reported gap is the low-margin phase-out: excluding it and currency, revenue grew 3.1%, and top-ten-customer revenue grew 3.6% [13]. But even on that normalized 3.1% basis, Amdocs still grew more slowly than the two peers whose business is closest to a modern BSS/OSS product — Oracle at 8.4% and Cerillion at 3.7%. The phase-out explains why the reported number is the worst in the set; it does not turn Amdocs into a peer-beating grower. Normalized, it grows roughly in line with a mature carrier end market and behind the product-based challengers — which is the durability question, not the accounting one.
The axis of attack
The challengers are not attacking Amdocs on price. They are attacking the model — bespoke, integration-heavy systems built around a specific carrier — and they say so by name. Of the entire peer shelf, CSG Systems is the one rival whose 10-K names Amdocs directly: it lists its competitors as "companies who deliver on-premise bespoke custom offerings (i.e., Amdocs Limited, NEC Netcracker)," positioning its own cloud and SaaS revenue-management platform as the alternative [14]. "On-premise bespoke custom incumbent" is the label the challenger side has chosen for Amdocs, and it defines the axis of competition: pre-integrated product versus custom integration.
That attack is landing on the estate Amdocs would consider its own. Cerillion, a small UK product vendor pitching a configurable off-the-shelf stack, booked a record £47.6 million of new orders in fiscal 2025, including a £25.3 million, five-year composite deal — its largest ever — to onboard an existing European customer's newly acquired tier-1 mobile subscriber base [15]. Cerillion's own revenue grew only 3.7%, but bookings are the leading indicator, and a tier-1 mobile base migrating onto a product platform is precisely the kind of work that historically defaulted to a bespoke integrator. One deal does not unseat an incumbent; it does show the unbundling thesis winning real tier-1 estate at the margin.
Amdocs is not standing still on that axis. Its own portfolio is being rebuilt around the challengers' vocabulary — an open, modular, microservices-based architecture designed for cloud migration and rapid deployment, matched to industry standards so customers can adopt pieces rather than a monolith [16]. The tension is that the cloud layer enabling this modernization is owned by the hyperscalers, who are Amdocs's named cloud partners and the platform onto which the whole industry's systems are moving — the same shift that lets a product challenger unbundle bespoke integration is the one Amdocs must ride to defend it. This plays out over a core carrier market that the prior act already established, through Ericsson, as mature rather than expanding [17].
The field is also consolidating on the challenger side. On October 29, 2025, NEC — parent of Netcracker, one of Amdocs's named rivals — agreed to acquire CSG Systems, the other named rival [18]. Two of the competitors Amdocs lists would sit under one owner, concentrating the challenger side of the market into fewer, better-capitalized hands.
Where the durability question lands
The evidence points two ways at once, and honestly so. The installed-base moat is real and quantified: $6.4 billion of remaining obligations, a base that renews near 100%, backlog up 2.7%, and revenue that grew where the contracts are sticky even as the total fell. On the other side, the growth franchise is genuinely contested — Amdocs is the peer set's slowest grower even normalized, its largest-but-one account is shrinking on lower discretionary spend, and the challengers are winning tier-1 estate on the axis where a four-decade integration heritage is not automatically an advantage — pre-integrated, cloud-native product. Even the 20-F concedes the market is "highly competitive" and expects competition to increase [19].
The read the evidence supports is a narrow, durable moat around the installed base and a contested position on new growth — entrenchment that defends the cash but does not, on its own, expand the franchise. What would settle which force wins is observable and dated: whether Amdocs's cloud-native and GenAI portfolio converts its embedment into share against product challengers faster than pre-integrated SaaS can unbundle bespoke integration, and whether the T-Mobile drawdown proves to be a single carrier's budget cycle or the leading edge of a broader re-scoping. Both are questions of execution against a promise. Whether management's promises have been worth their word — and who is steering as the pivot is asked of them — is where the record goes next.
Word Versus Deed
The cloud-and-GenAI pivot that has to carry the franchise (Moat or Melting Ice) is a promise before it is a result — which makes management's track record the thing to read next. Amdocs gives a reader two records to weigh, not one. On the horizon of a single quarter or fiscal year, the numbers management commits to are hit with a precision that is rare. On the horizon of several years — the strategy, the growth rate, the "new engine" — the commitments have been made, restated, and pushed out. The two records point in different directions, and the leadership team that built both is, as of fiscal 2026, entirely replaced.
The quarterly word
The near-term record is the strong one, and it is genuinely strong. At the November 2024 call, management set fiscal-2025 targets across three lines: pro forma constant-currency revenue growth of 1% to 4.5%, a non-GAAP operating margin that would "surpass 21% for the first time," and non-GAAP diluted earnings-per-share growth of 6.5% to 10.5% [1]. A year later, every one of those lines landed inside its range: pro forma revenue grew 3.1% [2], the non-GAAP operating margin reached 21.6% in the fourth quarter [3], and non-GAAP EPS growth came in near the middle of its band.
Sources: fiscal-2025 guidance, Q4 FY2024 call [1]; revenue outcome, FY2025 20-F [2]; margin outcome, Q4 FY2025 call [3].
This is not a one-year fluke; it is the house style. Guidance ranges are set narrow, revisited each quarter, and delivered — a discipline the deep backlog and near-100% managed-services renewal make possible, since most of the coming year's revenue is contracted before the year begins. A reader can trust the next four quarters of Amdocs guidance more than at most companies its size. The one asterisk carries forward from the FY2025 decode (The Engineered Decline): the "+3.1%" that cleared guidance is the pro forma, constant-currency, phase-out-adjusted number, roughly twelve points above the −9.4% that sits on the income statement. The word management keeps is kept in the metric management chose.
The multi-year word
The longer-horizon record reads differently. In November 2021, coming off a year management described as 7% constant-currency growth on a record $3.7 billion backlog [4], the framing was acceleration: the company was in "the early innings of a multiyear 5G and cloud-driven investment and transformation cycle" [5], and those "megatrends are here to stay for several years" [6]. Four years on, the megatrends arrived and the growth rate did not accelerate. By the November 2025 call the CEO's own words had inverted the framing: "in order for us to break this 3% and to go to a mid-single digit that we would like to be, we need more than one growth engine" [7]. The "early innings" of 2021 settled into a 3% ceiling that management now describes as needing a second engine that has not yet arrived.
Sources: FY2021 growth and backlog, Q4 FY2021 call [4]; 3% ceiling, Q4 FY2025 call [7]; cash-conversion targets, Q4 FY2021 [8] and Q4 FY2025 [9].
The clearest case is generative AI. Amdocs has named GenAI as its next growth engine on essentially every call since the third fiscal quarter of 2023, when it launched a telco-specific framework, amAIz, to "establish Amdocs as the telecom industry's leader in the rapidly emerging field of Generative AI" [10]. That was mid-2023 — the same window in which the stock set its high and began the drawdown the report opened on. Three years later, the vision is larger and the revenue is not yet visible: at the May 2026 call the new CEO built his entire outlook around a "GenAI-native era" and a purpose-built operating system, AOS, while conceding the company was "still in the process of refining our strategy" with only initial commercial agreements to show [11]. Fiscal-2026 revenue guidance was reiterated at a 3% constant-currency midpoint on the same call [12]: whatever GenAI eventually becomes, it is not in the growth line management is willing to underwrite for the year in progress. A promise that recurs on twelve consecutive calls without moving the guided number is itself the finding.
Moved reference points
Two of the company's own yardsticks have quietly shifted, both in the direction that makes the record easier to keep. The cash-conversion target is the cleaner example. In 2021 the CFO told investors to "expect us to convert at par, meaning 100%" [8]. Fiscal-2026 guidance instead targets a conversion rate of "roughly 90%" — and measures it against non-GAAP net income, which is the higher, adjusted figure [9]. The bar came down ten points and the reference it is measured against went up. The second shift is the one already noted: the growth metric management leads with is now pro forma constant currency, the basis on which a −9.4% reported year reads as +3.1%.
The growth that does get reported, meanwhile, is increasingly bought rather than built. Management has been explicit that "roughly half of the expected growth in fiscal 26 will be inorganic in nature" [13]. Against a ~3% constant-currency midpoint, that leaves organic growth near 1.5%. The acquisitions are real and recent: the $197 million cash purchase of Matrix Software closed at the start of fiscal 2026 [14], on top of four smaller deals in fiscal 2025 (led by Profinit and the telco-network business of MOBIA) for about $84 million [15]. The point is not that acquiring is wrong; it is that the reported ~3% and the organic ~1.5% are two different franchises, and the said-versus-did gap is wider on the second.
Source: fiscal-2026 guidance and the "roughly half inorganic" split, Q2 FY2026 call [13]; organic residual derived against the reiterated 3% midpoint [12].
There is one multi-year commitment management has delivered on without an asterisk: returning cash. Buybacks and a dividend raised every year have shrunk the diluted share count roughly 9.6% over four years, and that lever has done most of the per-share work while the top line stalled. What the buyback actually earned — the prices paid, the yield on offer, and whether the return is compounding or simply defending — is the arithmetic of Priced for Decline. Here it registers as the promise the company kept.
Who is steering now
Whatever weight a reader assigns to that record, it belongs to a management team that is no longer in place. Within fiscal 2026 both principal executives were replaced. In January 2026 the company announced that Shuky Sheffer, CEO since October 2018, would retire on March 31, 2026 [16]; by the May 2026 call his successor, Shimie Hortig, was presenting his own vision as the new CEO [17]. On that same call, Tamar Rapaport-Dagim — CFO since 2007 and COO since 2018 — announced her own retirement, with Tal Rosenfeld, a two-decade Amdocs finance veteran, named as incoming CFO [18]. Both successors are internal, which favors continuity of the model; both handoffs land in the same year, which removes the two people who set and met the guidance discussed above at the moment the GenAI pivot is being asked of the company.
The board around them is independent in form and continuous in fact. Every board committee that matters — audit, compensation, and nominating/governance — is composed entirely of independent directors [19], the chair is non-executive, and there is a mandatory director retirement age of 73. Continuity shows up in who holds the senior seats. The non-executive chairman, Eli Gelman, is a former Amdocs CEO (2010 to 2018); his predecessor as chair, Robert Minicucci, has been a director since 1997 — his firm's funds were once among the company's largest shareholders — and still chairs the nominating and governance committee [20]. Both Minicucci and one other director required a formal one-year waiver of the retirement age to stay on into 2027 [21]. Board leadership runs through the people who ran the company.
Alignment and disclosure
Two features make the incentive structure unusually hard to read from the outside. The first is thin economic ownership. All directors and executive officers as a group — thirteen people — beneficially own 2.0% of the shares, a figure that already counts options exercisable within sixty days, and no individual director or officer owns as much as 1% [22]. Power sits with a dispersed institutional base — Fidelity's FMR at 16.2% and Pzena at 6.0%, both passive — not with management. Alignment therefore runs through annual equity grants rather than standing stakes.
Insider ownership (all D and O)
Largest holder (FMR)
Aggregate D and O pay, FY25 ($M)
Shares outstanding (M)
Source: security ownership and aggregate remuneration, FY2025 20-F Items 6–7 [22] [23].
The second is disclosure. As a Guernsey-incorporated foreign private issuer, Amdocs reports executive pay only in aggregate: about $6.0 million paid or accrued to all thirteen directors and officers combined in fiscal 2025 ($5.9 million and $6.3 million in the two prior years), with no individual figure for any named executive, no CEO pay ratio, and no separate shareholder vote on pay [23]. The equity that carries the alignment vests on "certain performance thresholds" the filing does not name — for example, 81,520 options struck at $92.00 with a roughly two-year performance period [23]. The same status exempts the company from the Section 16 filings that would otherwise let an outsider watch insiders buy or sell. Pay-for-performance is therefore not a question a reader can answer here — the metrics, the targets, and the trades are all outside view.
The formal safeguards are otherwise clean: related-party transactions are reported as none. Two standing levers sit outside shareholder consent, though. The Guernsey articles let the board issue up to 25,000,000 preferred and 700,000,000 ordinary shares — including non-voting ordinary shares — without a further shareholder vote, and permit interested-director contracts under Article 70(1) [24]. Against ~108 million shares outstanding, that is a large standing authorization; there is no record of its misuse, and it is a dilution and takeover-defense capability that does not require asking.
The record, then, splits by horizon and by kind. The quarterly word is reliable, the multi-year word is deferred, and the value actually delivered to a per-share holder to date has come from buying stock back rather than from the growth engine that was promised — all of it now in the hands of a leadership team appointed this year, whose pay and incentives an outside reader cannot inspect. That sets up the arithmetic Priced for Decline resolves: why a business that converts earnings to cash this cleanly trades at roughly eight times forward earnings, and what a buyer of that discount is paid to wait for.
Priced for Decline
The record so far describes a clean cash generator: a portfolio pruned on purpose (The Engineered Decline), a narrow contractual moat that defends the cash but does not expand the franchise (Moat or Melting Ice), and a management team whose quarterly word is reliable while its multi-year word keeps slipping (Word Versus Deed). None of that explains the price. At $55.28 on July 30, 2026, Amdocs changes hands for roughly 7.5 times the earnings a buyer is told to expect next year — a level normally reserved for businesses whose earnings are about to fall. This act resolves that gap: what moved, what a holder is paid while waiting, and whether the discount is a misjudgment or a re-rating the evidence supports.
What actually moved
The stock did not grind lower for three years. It round-tripped, then broke. Amdocs set a high of $94.21 on August 1, 2023, drifted, and recovered almost all the way back — $91.24 at the end of June 2025, within a whisker of the old high. The dislocation came after: from that mid-2025 level the shares fell to a $49.87 trough on June 25, 2026 before settling at $55.28, a slide of roughly 44% compressed into twelve months.
Source: daily price history, month-end closes; company filings, as reported.
The earnings did the opposite over the same stretch: they rose. On the normalized (non-GAAP) basis the company reports, diluted EPS was $6.99 in FY2025 [1], and consensus carries it to $7.41 in FY2026 and $8.06 in FY2027. Reported EPS also beat the consensus estimate in each of the last eight quarters — never by a wide margin, but never missing.
Source: consensus estimates and reported results, as reported (eight consecutive quarterly beats through Q2 FY2026).
Price and earnings moved in opposite directions, so the entire move sits in the multiple. At the mid-2025 peak the shares traded near 13 times normalized earnings; at $55.28 they trade at about 7.5 times the FY2026 consensus and under 7 times FY2027. The de-rating is a change in what investors will pay per dollar of earnings, not a fall in the dollars. Stated on the statutory basis The Engineered Decline insisted on — GAAP diluted EPS of $5.05 — the trailing multiple is near 11 times; lower-quality than the headline, but still a compression, not an earnings collapse.
Forward P/E (FY2026E)
Free Cash Flow Yield
Total Shareholder Yield
Source: price $55.28 (2026-07-30) over consensus FY2026 EPS $7.41; FY2026 consensus FCF yield and FY2025 buybacks-plus-dividends over market capitalization, per reported financials.
What a holder is paid to wait
A multiple this low pays the holder in cash. Free cash flow was $645.1 million in FY2025, a 10.4% yield on the $6.18 billion market value, and the forward consensus yield is essentially identical at 10.5% — the Street models no cash-flow deterioration into that number [2]. On top of the cash the business generates, the company returns more than all of it: FY2025 buybacks of $551.3 million and dividends of $224.4 million total $775.7 million, a 12.6% total shareholder yield, of which the roughly 3.8% annual share-count shrink lifts per-share earnings mechanically, independent of revenue.
Set against that cash return, every published analyst target sits above the market. The Street splits three buy, three hold, no sells; its targets run from a $70.84 low to a $74.50 median and a $105 high. The lowest of them is 28% above the $55.28 close, and the median implies 35%.
Source: consensus analyst price targets and current price, as reported.
The market is trading below the entire covering-analyst range. That is a fact about positioning, not a recommendation: it says the marginal seller disagrees with every published model, and it locates the burden of proof — the price embeds a path more pessimistic than the consensus it trades against.
The engine that carries per-share value
The reason the cash return matters so much is that it, not growth, is where Amdocs's per-share value has come from. Over FY2022 through FY2025 the company generated $2.49 billion of free cash flow and returned $2.93 billion to shareholders — about 118% of what it earned in cash — split roughly $2.11 billion of buybacks to $0.82 billion of dividends, a 2.6-to-1 tilt toward repurchases.
Source: FY2025 Annual Report (Form 20-F), Liquidity and Capital Resources and Consolidated Statements of Cash Flows [3].
The buybacks are real compounding, not a stock-based-compensation offset dressed up as one. Diluted shares fell from 123.65 million in FY2022 to 111.75 million in FY2025, down 9.6%, at roughly 3.3% a year. Amdocs repurchased 6.3 million shares in FY2025 alone, at an average price of $87.38 [4], against equity-based compensation of roughly $105 million — buyback spending outran new issuance several times over, so the count genuinely net-shrinks. Given flat-to-down revenue, that shrinking denominator is the mechanical driver of rising EPS. It is also the one multi-year promise (Word Versus Deed) that has actually been kept.
The dividend is the smaller, steadier leg. The quarterly rate rose from $0.435 in FY2023 to $0.479 in FY2024 to $0.527 in FY2025, and the board proposed a further step to $0.569 — about 8% — for FY2026, subject to the January 2026 shareholder vote [5]. Under Guernsey law a dividend increase needs shareholder approval, an unusual gate versus a US board-set dividend; every proposed step has passed, and the per-share dividend has compounded near 10% a year.
The price paid, and the balance sheet behind it
Two facts complicate the compounding story. The first is price. Amdocs bought back stock at an average of roughly $90 in FY2023, $85 in FY2024, and $87.38 in FY2025 — three straight vintages struck 35% to 45% above today's $55.28. Mechanically the buyback still retires shares and lifts EPS; economically, whether those dollars were well spent depends on whether $55 is a misjudgment or the right number — the same fork this chapter keeps returning to.
Source: FY2025 Annual Report (Form 20-F), Item 16E Purchases of Equity Securities [6]; current price as reported.
The second is how the program is funded. Returning more than 100% of free cash flow has to come from somewhere, and it has come from the balance sheet. Gross debt was static for years — a single $650 million Senior Notes issue at a 2.538% fixed rate maturing in 2030, with the $500 million revolver undrawn [7] — so the extra return drew cash down instead: net debt rose from $71.7 million in FY2022 to $321.9 million in FY2025 as cash was spent, not borrowed. That changed in FY2026. By the quarter ended March 31, 2026 the company held $214 million of cash against roughly $900 million of aggregate borrowings, having established a US commercial-paper program of up to $1.08 billion and upsized its revolver to support it [8]. At the same time the $986.4 million of buyback authority left in September 2025 [9] is being consumed at roughly $135–145 million a quarter. Management still frames the policy as returning "the majority of our free cash flow to shareholders" [10], but the arithmetic has shifted: sustaining the pace now leans on short-term borrowing rather than current cash generation, and the next authorization is a fresh decision about whether to fund the engine with debt.
The peer screen that misleads
Two of the anomalies flagged for this chapter come from the same corrupted number, and both should be set aside. A screen puts Amdocs's trailing FCF yield of 10.4% against a "peer median" of 46.5% — a 3,610 basis-point gap that would look alarming if it were real. It is not. The median is dragged by Ericsson's reported 89% FCF yield, which divides Swedish-krona free cash flow by a US-dollar market value — a currency mismatch, not a yield. The only clean cross-currency comparison in the set is Amdocs at 10.4% versus Cerillion at 3.7%, on which Amdocs's cash yield is the higher of the two. The "peer FCF-yield gap" is a data artifact and carries no signal.
The drawdown itself is not idiosyncratic. Amdocs is off 41.3% from its three-year high, close to the peer median of 38.8% — Oracle fell 61.1%, Cerillion 48.7%, Ericsson 28.9%, and Tech Mahindra just 7.1%. The whole cohort re-rated; Amdocs sits in the middle of it, neither the worst-hit nor spared.
Source: price histories, drawdown from trailing three-year high, as reported.
Mispricing or re-rating
How one reads that collapsed multiple splits the evidence two ways, and the facts point in both directions without settling it.
The case that the discount is a misjudgment: normalized EPS rose and beat for eight straight quarters while the price fell 44%; the forward cash-flow yield of 10.5% matches the trailing yield, so consensus sees no cash deterioration; the buyback shrinks the count near 4% a year on its own; and the market trades below every published target, the nearest of which is 28% higher. On those facts the price embeds a decline the numbers do not yet show.
The case that the re-rating is earned: the growth that would justify a higher multiple is thin and partly bought — organic growth near 1.5%, half of FY2026 growth inorganic (Word Versus Deed) — while the delivery model is under attack from pre-integrated cloud and GenAI challengers (Moat or Melting Ice), and the single largest customer is guided down in FY2026. A durable but non-expanding franchise, financing an above-FCF payout with fresh borrowing, is a lower-multiple business than the one the mid-2025 price assumed. The outer-year EPS line the low multiple appears to doubt is itself thinly underwritten — consensus coverage thins to a couple of houses two years out, so the double-digit forward growth curve is closer to one view than a settled one.
The evidence does not decide it here; the judgment belongs to the layer that weighs it. What would decide it is checkable, and the near-term tests are dated:
| Watch item | Where it shows up | What tips the read |
|---|---|---|
| Forward free cash flow yield holding near 10.5% | FY2026 cash-flow statement vs the drawn-down balance sheet | FCF that funds the payout without further borrowing supports mispricing; a shortfall supports re-rating |
| The next buyback authorization and how it is funded | Board authorization after the ~$986M plan is exhausted | A debt-funded refill signals the return is leaning on leverage, not cash |
| T-Mobile FY2026 revenue trajectory | FY2026 quarterly results (the ~20%-of-revenue account, Moat or Melting Ice) | A one-cycle dip supports the cash case; a step-down deepens the re-rating case |
| Re-rating toward the Street floor of $70.84 | The multiple itself, quarter to quarter | Movement toward the target range would confirm the discount was mispricing |
The business generates the cash; the market has decided to pay eight times forward earnings for it and lends the holder a 12.6% annual return to wait. Whether that is a bargain or a fair price for a franchise that defends its cash without growing it is the question the coming year of cash flow, capital authorizations, and the T-Mobile renewal will answer.
The numbers behind Amdocs Limited: as-reported financial statements and company metrics for FY2021–FY2025, traced to the source filings, opened with the share-price history those statements have to justify. Every linked figure opens the exact page of the filing it was printed on, with the statement row highlighted. Amounts in US$ thousands unless noted.
Reading notes: All figures are as printed in Amdocs' filings, in thousands of US dollars (the filings state 'In thousands, except per share data'); per-share figures in US dollars. Amdocs is a Guernsey-incorporated foreign private issuer and files an annual report on Form 20-F (fiscal year ends September 30), not a Form 10-K. Each 20-F prints three years of the income and cash-flow statements and two years of the balance sheet. FY2023–FY2025 income and cash-flow figures are cited to the FY2025 20-F (which shows all three years); FY2021–FY2022 to the FY2022 20-F. Balance-sheet FY2024–FY2025 cited to the FY2025 20-F, FY2023 to the FY2023 20-F, FY2021–FY2022 to the FY2022 20-F. Long-Term Record FY2019–FY2020 are drawn from comparative columns of the FY2021 and FY2022 20-Fs.
Share Price — Full Available History — 28 Years
The stock closed at $55.28 on Jul 30, 2026 — up 295% over the window shown (+5.0% a year), trading between $5.95 and $98.85. At that close the stock trades at 11× FY2025 diluted EPS as reported below.
Source: market price feed, monthly closes, sampled from 7,071 source observations, Jun 1998–Jul 2026. Price return only, excludes dividends.
Market capitalization $6.8bn and enterprise value $7.2bn.
Market cap = 123.7M shares outstanding × the Jul 30, 2026 close of $55.28. Enterprise value adds total debt of $647mn and subtracts cash and equivalents of $325mn (net debt of $322mn), from the FY2025 balance sheet. Market-derived figures, shown without filing links.
FY2025 at a Glance
Revenue (US$ thousands)
Operating income (US$ thousands)
Net income (US$ thousands)
Diluted EPS
Source: FY2025 consolidated statements [1] [2]. Click any linked figure to open the filing page with the row highlighted.
Revenue by Geography
| Revenue by Geography | FY2021 | FY2022 | FY2023 | FY2024 | FY2025 |
|---|---|---|---|---|---|
| North America (mainly United States) | 2,791,472 | 3,100,038 | 3,306,988 | 3,325,967 | 2,983,553 |
| Europe | 622,780 | 582,192 | 703,141 | 726,226 | 705,107 |
| Rest of the world | 874,388 | 894,467 | 877,421 | 952,796 | 844,253 |
| Total revenue | 4,288,640 | 4,576,697 | 4,887,550 | 5,004,989 | 4,532,913 |
| Total revenue growth, derived | — | +6.7% | +6.8% | +2.4% | -9.4% |
Source: Note 22 — Segment Information and Revenue from Significant Customers; Geographic Information (revenue attributed to customer location) [3] [4]. Click any linked figure to open the filing page with the row highlighted.
Income Statement
Source: Consolidated Statements of Income (Form 20-F); FY2023–FY2025 from the FY2025 20-F, FY2021–FY2022 from the FY2022 20-F [1] [2]. Click any linked figure to open the filing page with the row highlighted.
Columns marked E are consensus analyst estimates from S&P Capital IQ (CapIQ), shown alongside reported results for direct comparison; they are not company guidance.
Estimate source: S&P Capital IQ (CapIQ) consensus, as of 2026-07-31. Estimate figures are S&P Capital IQ consensus (vendor data — no filing page links). EPS and net income use the normalized (adjusted) consensus where the street reports it. Line-item analyst models (segments, drivers, KPIs) are in the Visible Alpha tab.
Balance Sheet
Source: Consolidated Balance Sheets (Form 20-F); FY2024–FY2025 from the FY2025 20-F, FY2023 from the FY2023 20-F, FY2021–FY2022 from the FY2022 20-F [5] [6] [7]. Click any linked figure to open the filing page with the row highlighted.
Cash Flow
Source: Consolidated Statements of Cash Flows (Form 20-F); FY2023–FY2025 from the FY2025 20-F, FY2021–FY2022 from the FY2022 20-F [8] [9]. Click any linked figure to open the filing page with the row highlighted.
Revenue by Nature of Activities
| Revenue by Nature of Activities | FY2021 | FY2022 | FY2023 | FY2024 | FY2025 |
|---|---|---|---|---|---|
| Managed services arrangements | 2,546,330 | 2,755,486 | 2,856,621 | 2,904,924 | 2,995,763 |
| Others | 1,742,310 | 1,821,211 | 2,030,929 | 2,100,065 | 1,537,150 |
| Total revenue | 4,288,640 | 4,576,697 | 4,887,550 | 5,004,989 | 4,532,913 |
Source: Note 22 — Revenue by nature of activities (managed services arrangements vs. other) [3] [10]. Click any linked figure to open the filing page with the row highlighted.
Sales Visibility Cash Generation
| Sales Visibility Cash Generation | FY2021 | FY2022 | FY2023 | FY2024 | FY2025 |
|---|---|---|---|---|---|
| Twelve-month backlog | — | — | 4,150,000 | 4,060,000 | 4,190,000 |
| Free cash flow | — | 529,500 | 698,268 | 618,933 | 645,144 |
| Remaining performance obligations (RPO) | — | — | — | 5,900,000 | 6,400,000 |
Source: company filings [11] [12] [13] [14]. Click any linked figure to open the filing page with the row highlighted.
Non-GAAP Profitability (Company-Defined)
| Non-GAAP Profitability (Company-Defined) | FY2021 | FY2022 | FY2023 | FY2024 | FY2025 |
|---|---|---|---|---|---|
| Non-GAAP operating income | — | 804,894 | 868,602 | 923,288 | 968,330 |
| Non-GAAP net income attributable to Amdocs Limited | — | 655,147 | 712,201 | 747,804 | 781,202 |
| Non-GAAP diluted earnings per share | — | 5.30 | 5.91 | 6.44 | 6.99 |
Source: company filings [11] [15]. Click any linked figure to open the filing page with the row highlighted.
Customer Concentration
| Customer Concentration | FY2021 | FY2022 | FY2023 | FY2024 | FY2025 |
|---|---|---|---|---|---|
| AT T — largest customer (% of revenue) | — | — | 23.8% | 24.5% | 25.9% |
| T-Mobile — second-largest customer (% of revenue) | — | — | 23.1% | 22.6% | 19.9% |
| Ten largest customers (% of revenue) | — | — | — | 70.0% | 70.0% |
Source: company filings [16] [17]. Click any linked figure to open the filing page with the row highlighted.
Global Workforce
| Global Workforce | FY2021 | FY2022 | FY2023 | FY2024 | FY2025 |
|---|---|---|---|---|---|
| Total workforce | — | — | 30,695 | 29,058 | 26,969 |
| Software, IT, Sales Marketing — Americas | — | — | 6,112 | 5,480 | 4,778 |
| Software, IT, Sales Marketing — EMEA | — | — | 6,353 | 6,000 | 5,488 |
| Software, IT, Sales Marketing — APAC | — | — | 16,530 | 15,958 | 15,226 |
| Management and administration | — | — | 1,700 | 1,620 | 1,477 |
Source: company filings [18]. Click any linked figure to open the filing page with the row highlighted.
Long-Term Record
| Fiscal year | Total revenue | Operating income | Net income | Diluted earnings per share | Net cash provided by operating activities |
|---|---|---|---|---|---|
| FY2019 | 4,086,669 | 569,746 | 479,446 | 3.47 | 656,377 |
| FY2020 | 4,169,039 | 594,758 | 497,840 | 3.71 | 658,136 |
| FY2021 | 4,288,640 | 598,693 | 688,374 | 5.32 | 925,807 |
| FY2022 | 4,576,697 | 664,797 | 549,501 | 4.44 | 756,719 |
| FY2023 | 4,887,550 | 653,990 | 540,709 | 4.49 | 822,630 |
| FY2024 | 5,004,989 | 628,608 | 493,197 | 4.25 | 724,428 |
| FY2025 | 4,532,913 | 731,664 | 564,704 | 5.05 | 749,096 |
Source: consolidated statements across filings; older years from the standardized feed [8] [1] [9] [2]. Click any linked figure to open the filing page with the row highlighted.
Analyst Consensus
Mean target
Median target
High target
Low target
Street ratings: 3 strong buy, 3 hold. Consensus: Buy.
Estimate source: S&P Capital IQ (CapIQ) consensus, as of 2026-07-31. Estimate figures are S&P Capital IQ consensus (vendor data — no filing page links). EPS and net income use the normalized (adjusted) consensus where the street reports it. Line-item analyst models (segments, drivers, KPIs) are in the Visible Alpha tab.
Traceability
321 of 322 figures on this page (100%) link to the filing page where they are printed — click a linked figure to open the source PDF at that page with the row highlighted. Unlinked figures come from standardized data feeds or pre-filing years.
All figures are as printed in Amdocs' filings, in thousands of US dollars (the filings state 'In thousands, except per share data'); per-share figures in US dollars.
Amdocs is a Guernsey-incorporated foreign private issuer and files an annual report on Form 20-F (fiscal year ends September 30), not a Form 10-K. Each 20-F prints three years of the income and cash-flow statements and two years of the balance sheet.
FY2023–FY2025 income and cash-flow figures are cited to the FY2025 20-F (which shows all three years); FY2021–FY2022 to the FY2022 20-F. Balance-sheet FY2024–FY2025 cited to the FY2025 20-F, FY2023 to the FY2023 20-F, FY2021–FY2022 to the FY2022 20-F.
Long-Term Record FY2019–FY2020 are drawn from comparative columns of the FY2021 and FY2022 20-Fs.
Amdocs manages its business as a single operating segment; the revenue disaggregations shown (by geography and by nature of activities) are the company's own Note 22 breakouts. The income statement presents operating expenses without a gross-profit subtotal, so none is shown.
For FY2021–FY2022 the income statement predates the separate presentation of restructuring charges and of net income attributable to noncontrolling interests, so those rows are null; reported 'Net income' for those years equals the amount attributable to Amdocs Limited.
Quarterly income-statement figures are single-quarter (three-month) columns as printed. Quarterly cash-flow figures are derived from the printed year-to-date statements (see the cash-flow note); every derived value was cross-checked against data/financials/cash_flow_quarterly.json and matched exactly.
2 figure(s) differed between the data feed and the filing; the filing value is shown (see the run's metrics/metrics_tab.json for the audit trail).
Amdocs Limited's management explains the business in its own materials. The slides below do the most of that work, pulled from the documents preserved in Sources. Each source link opens the complete presentation at that slide in a new tab.
Second Quarter Fiscal 2026 Investor Presentation — Q2 FY2026
The newest investor deck: new CEO Shimie Hortig's 'agentic' strategy, the aOS launch, and the current financial profile and outlook. · Open the full document →
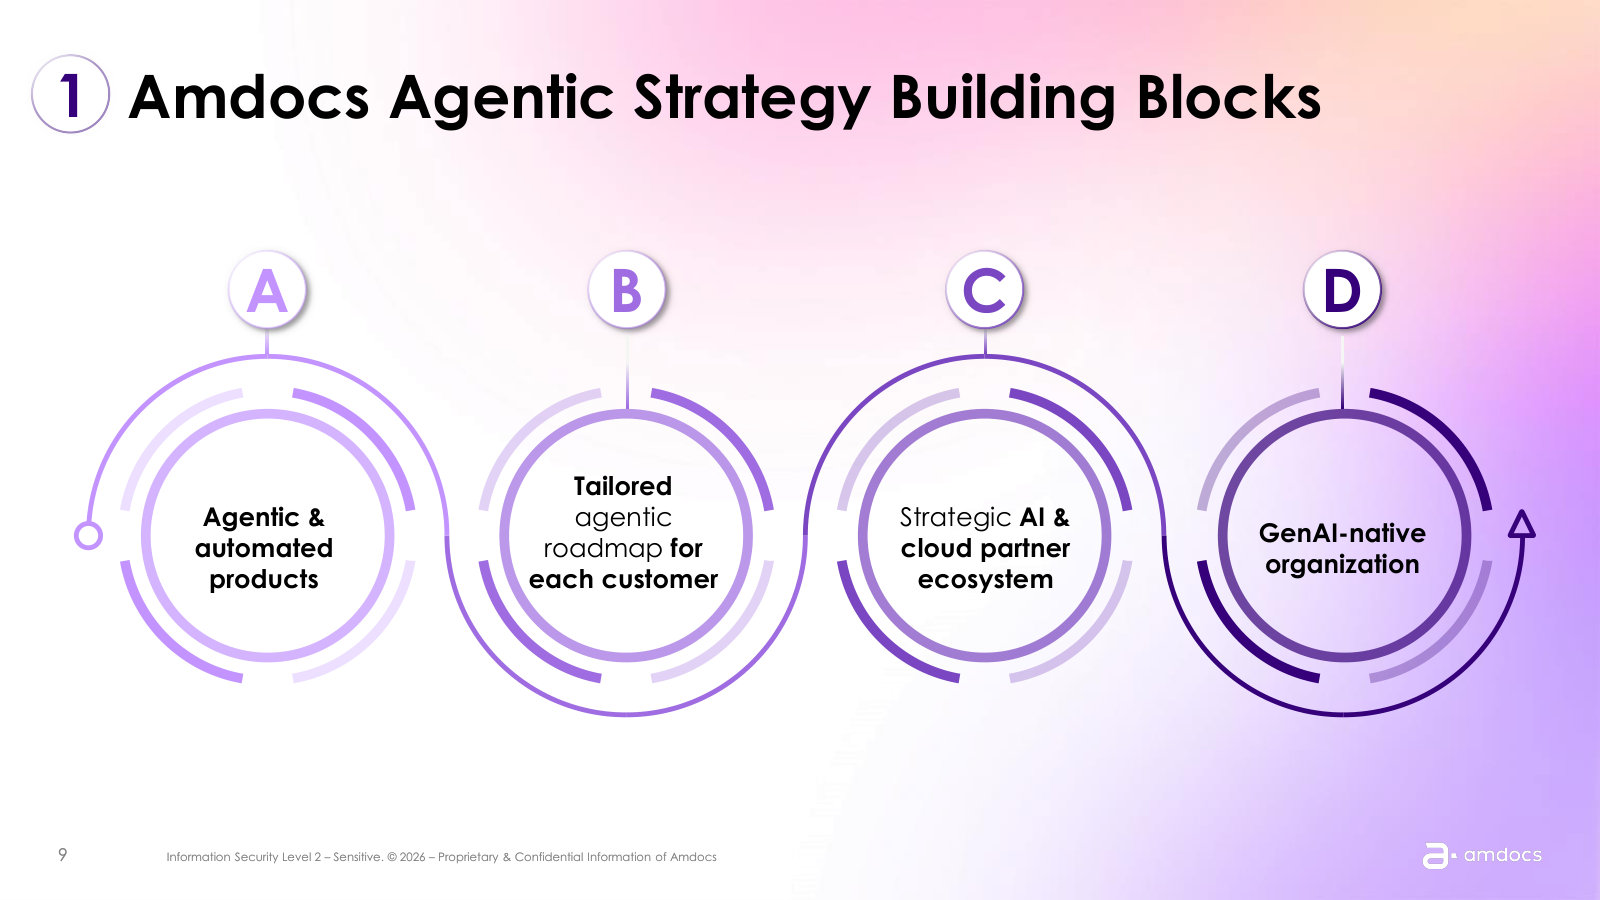
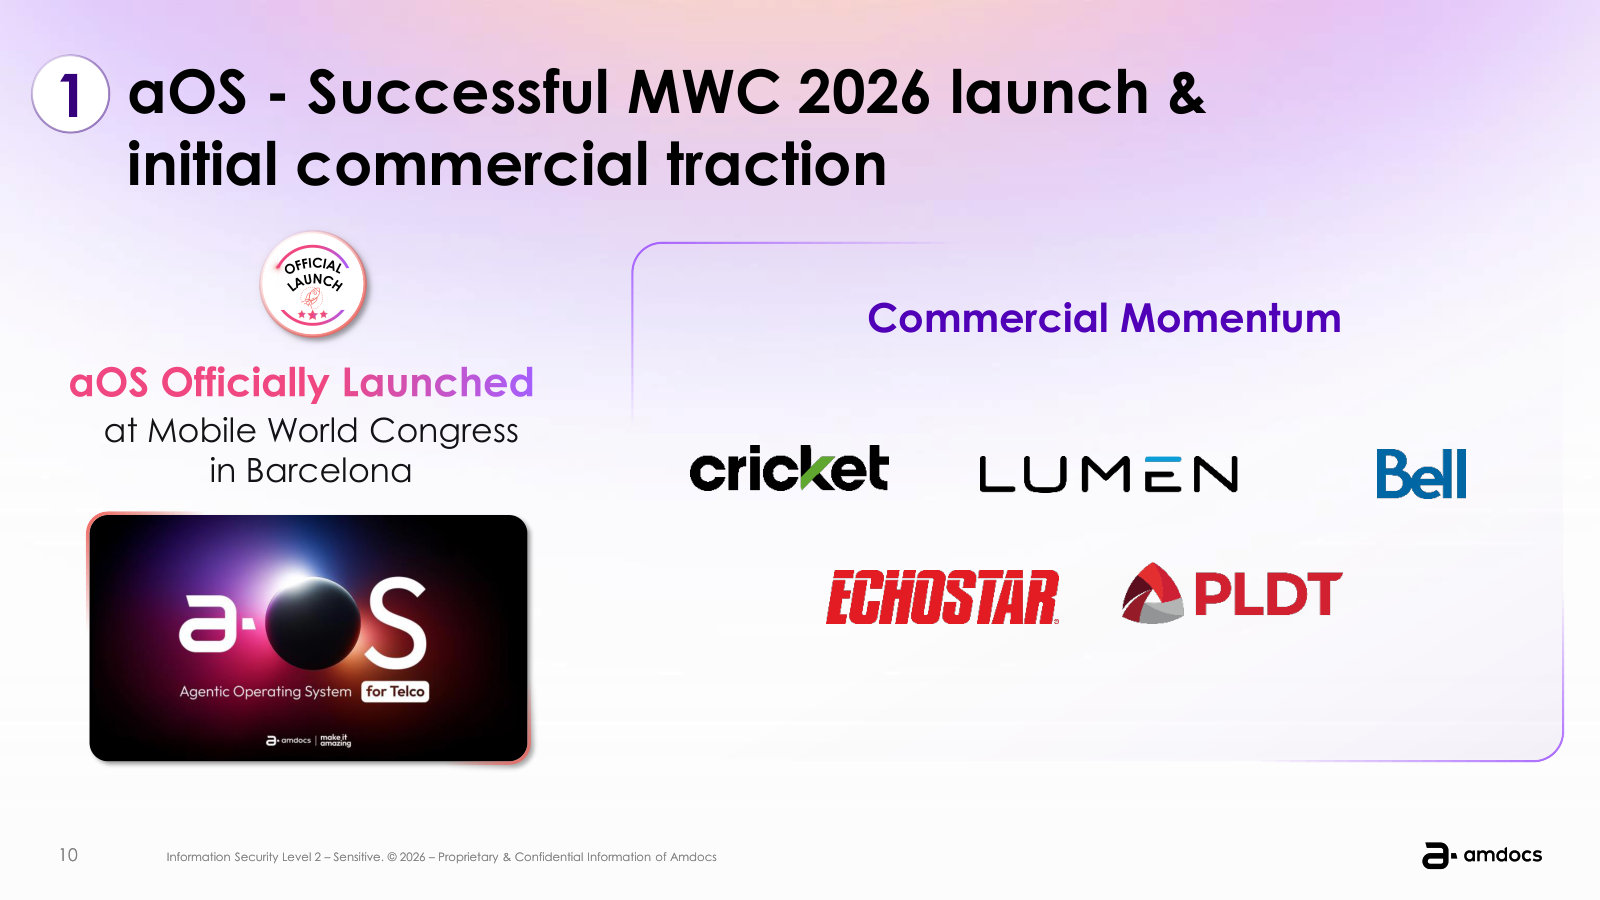
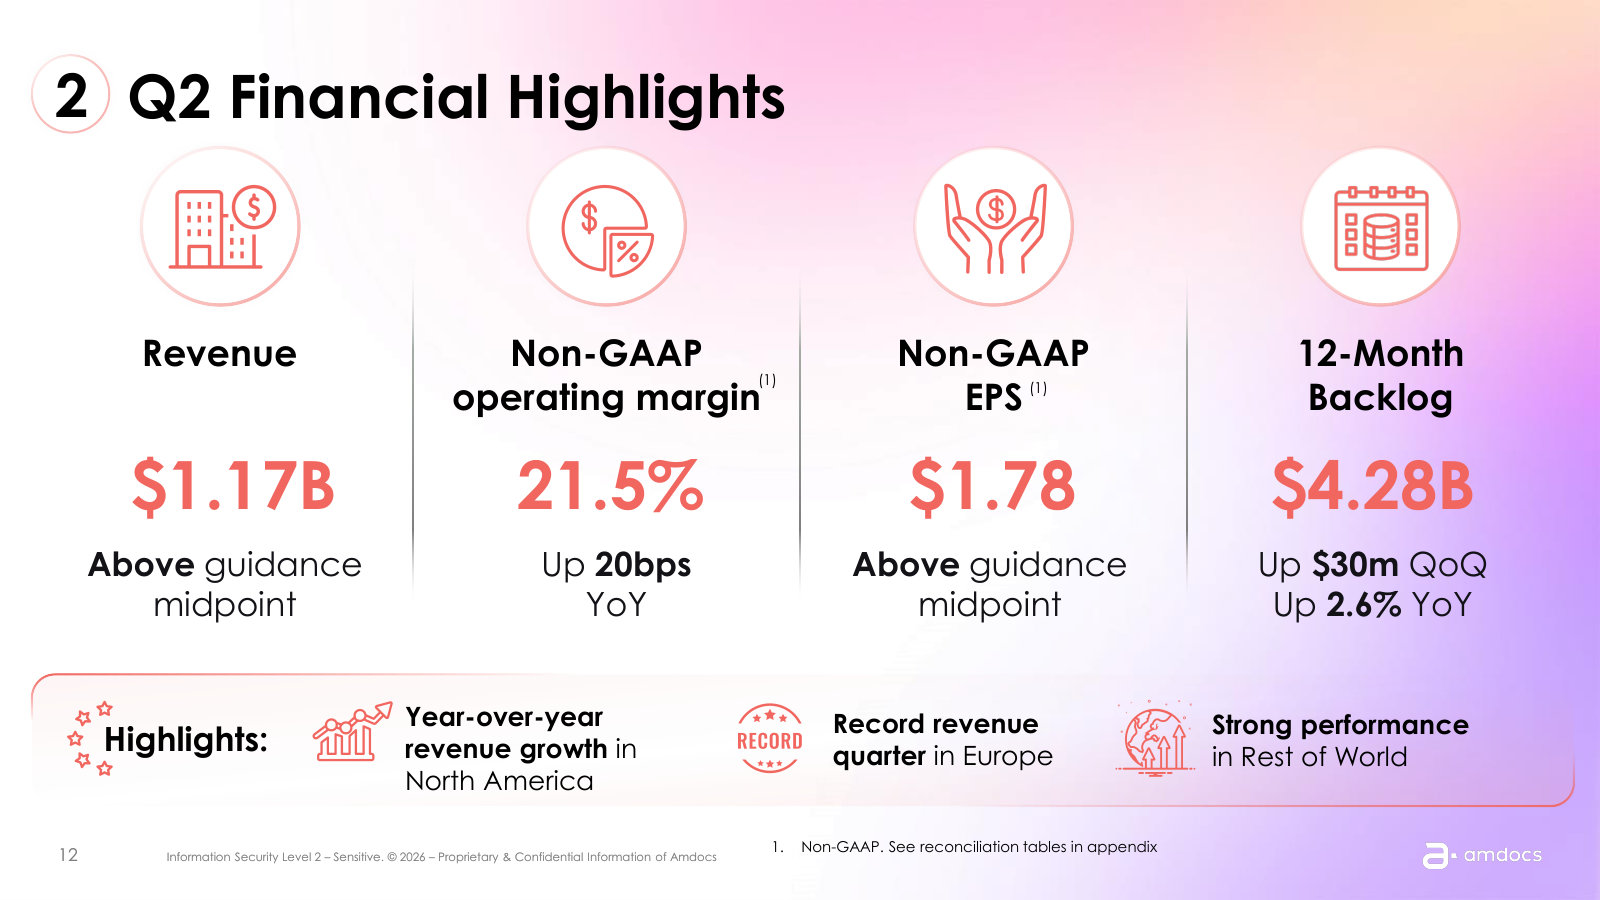
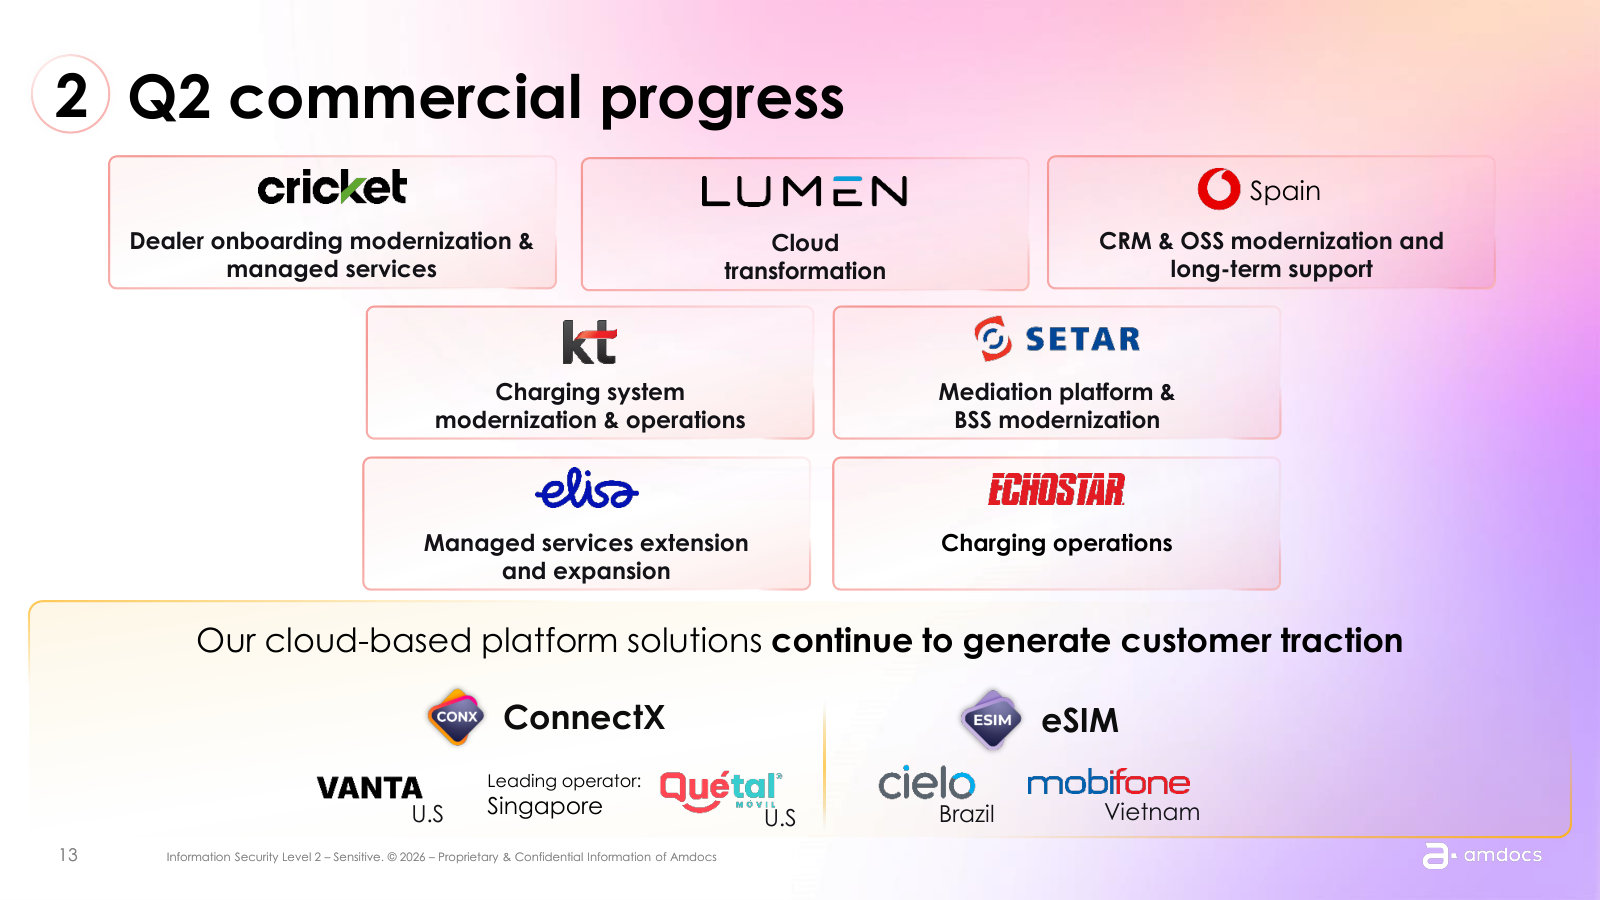
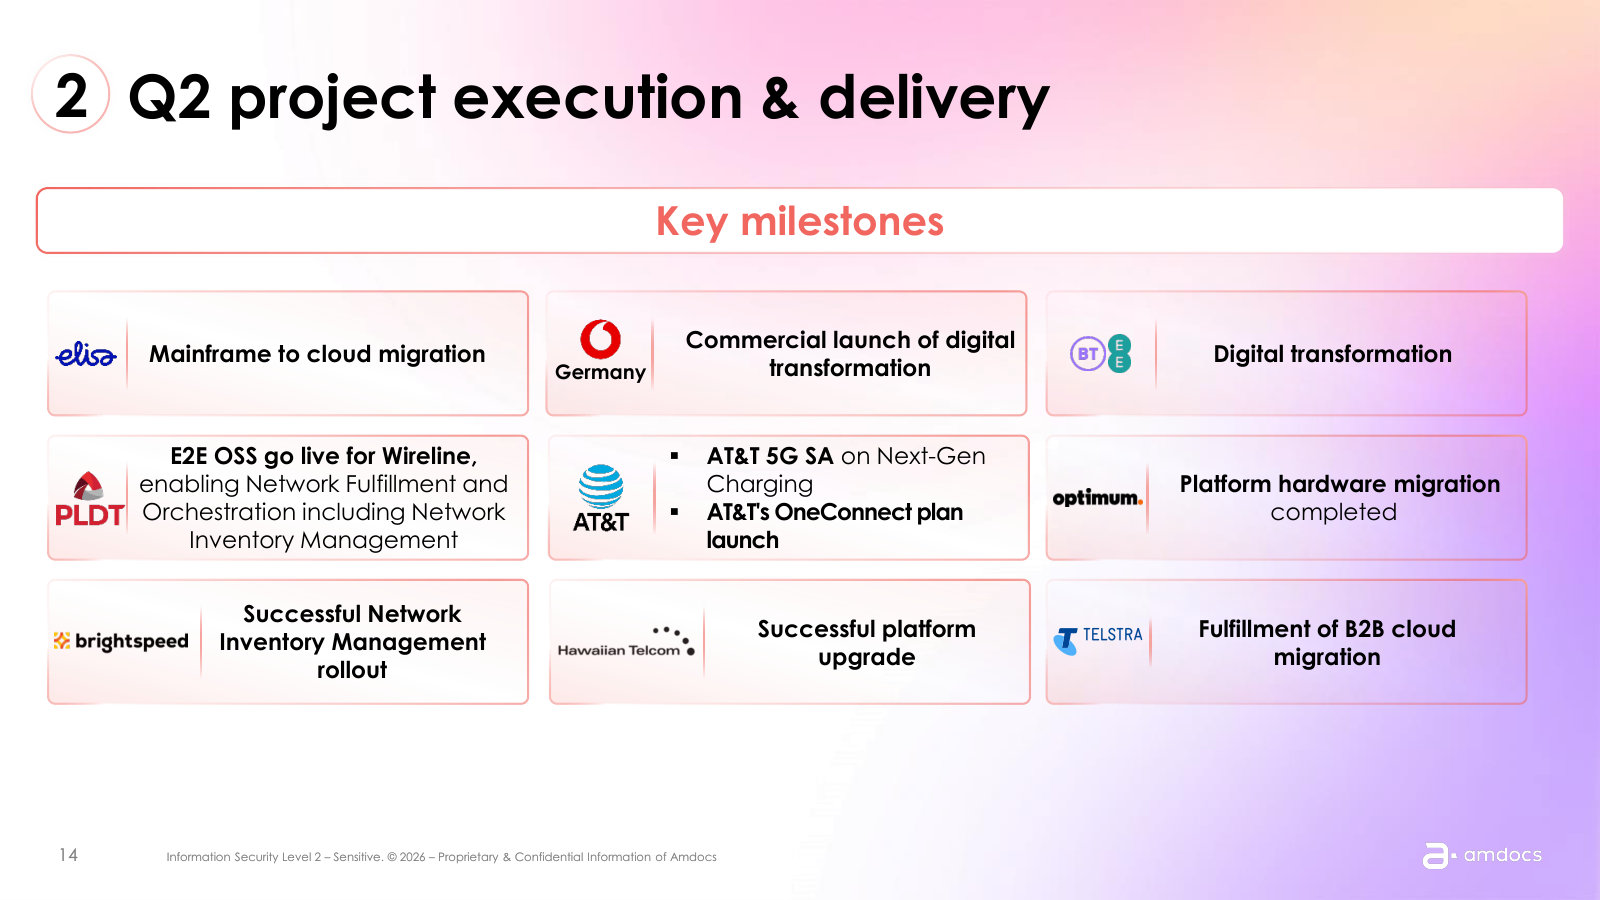
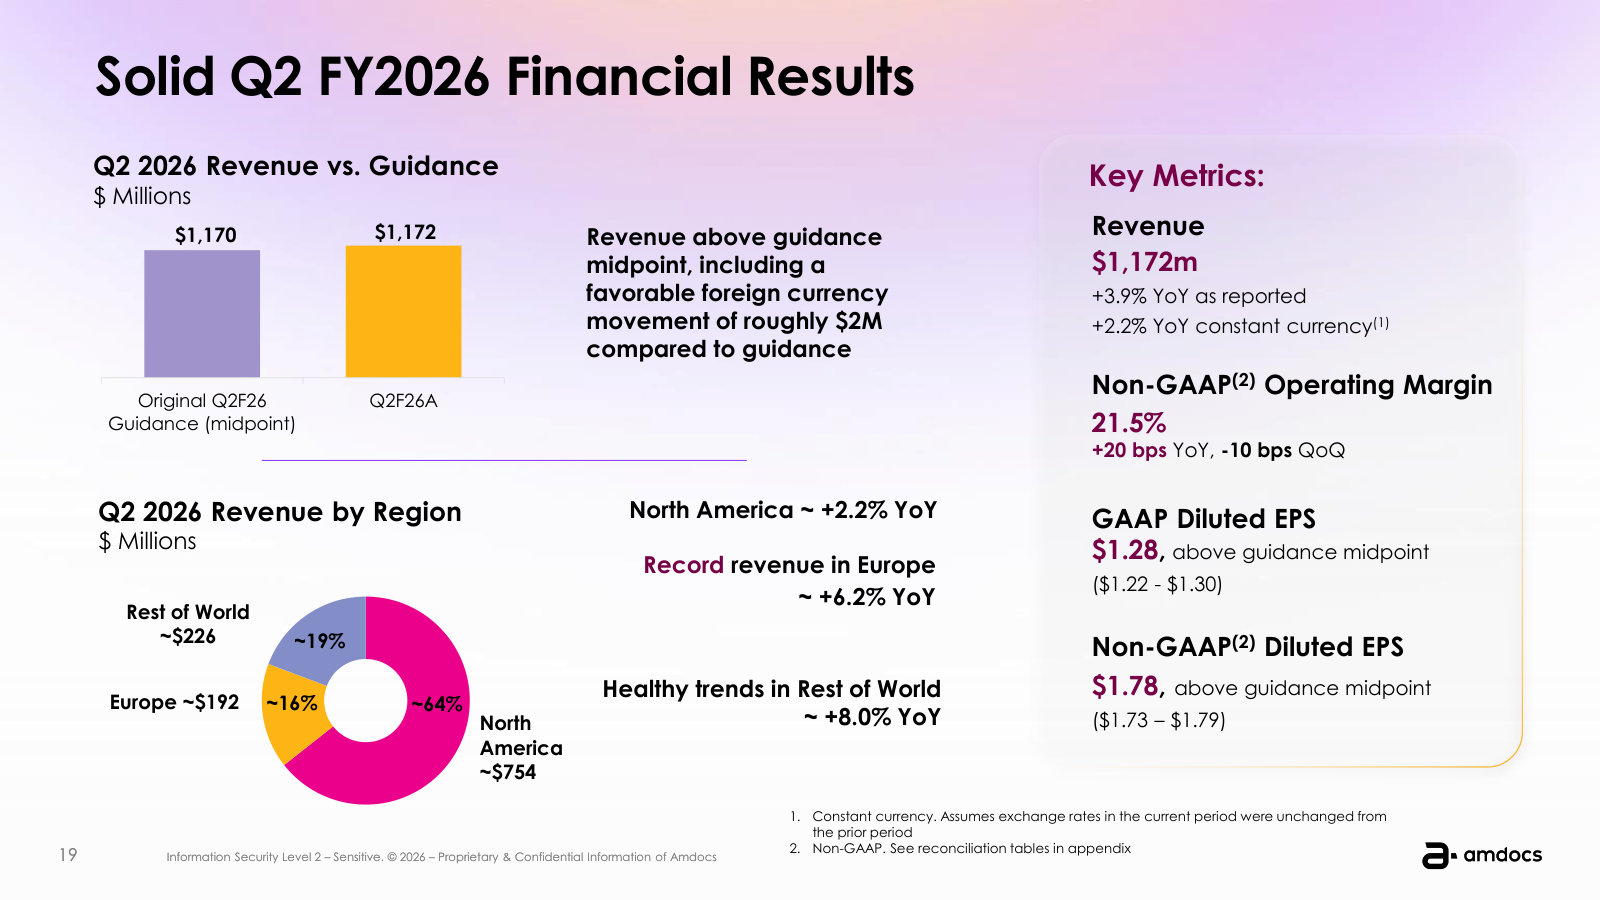
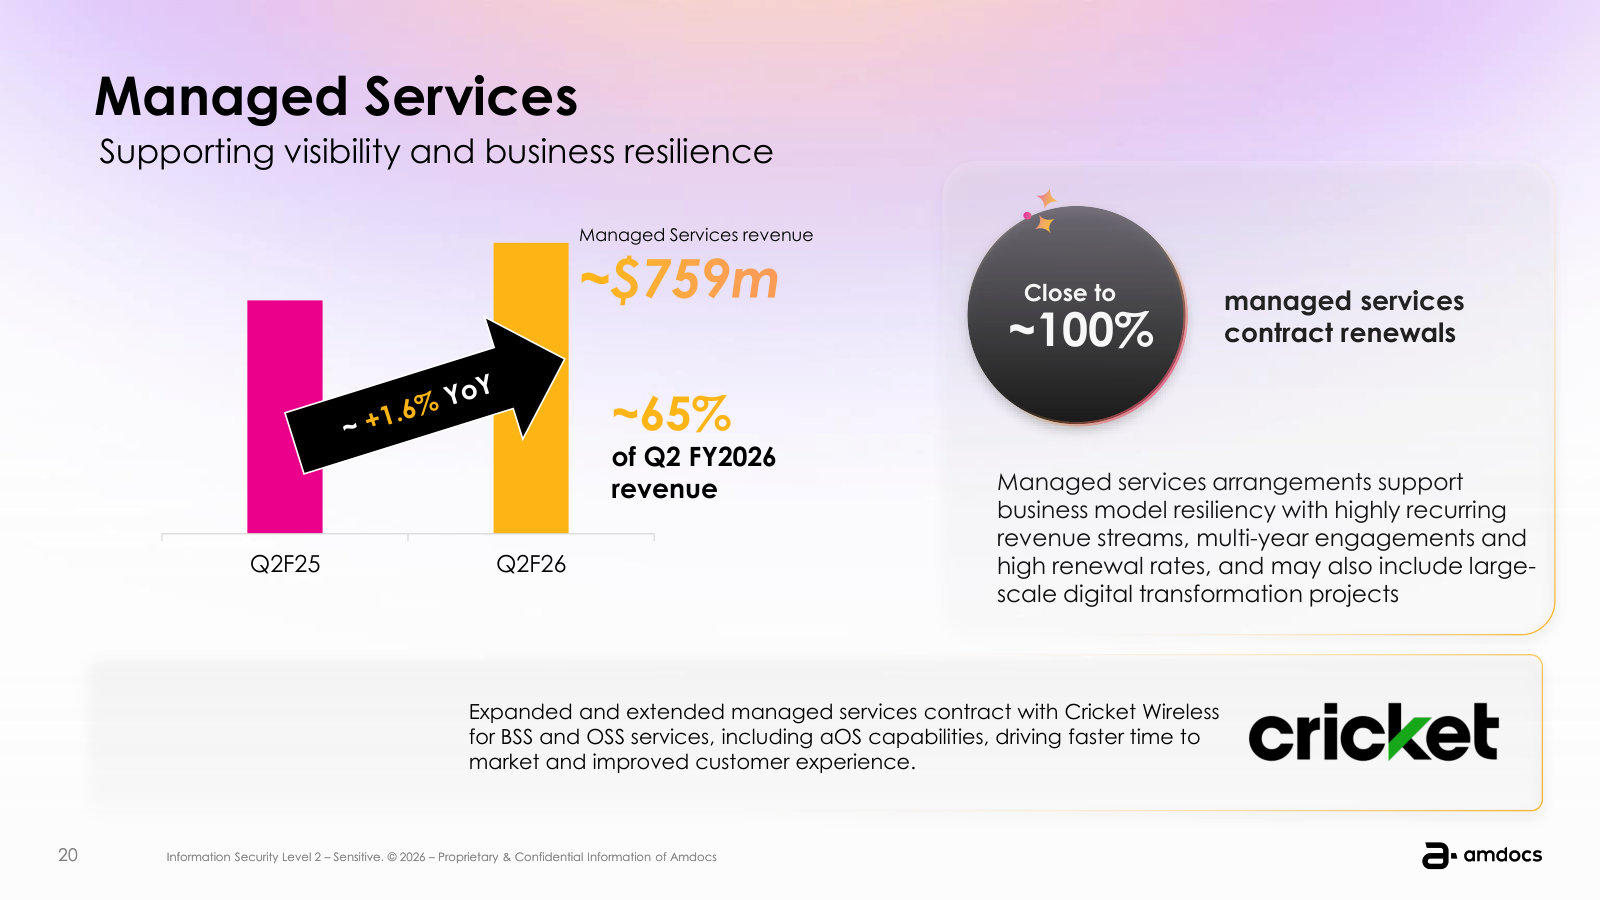
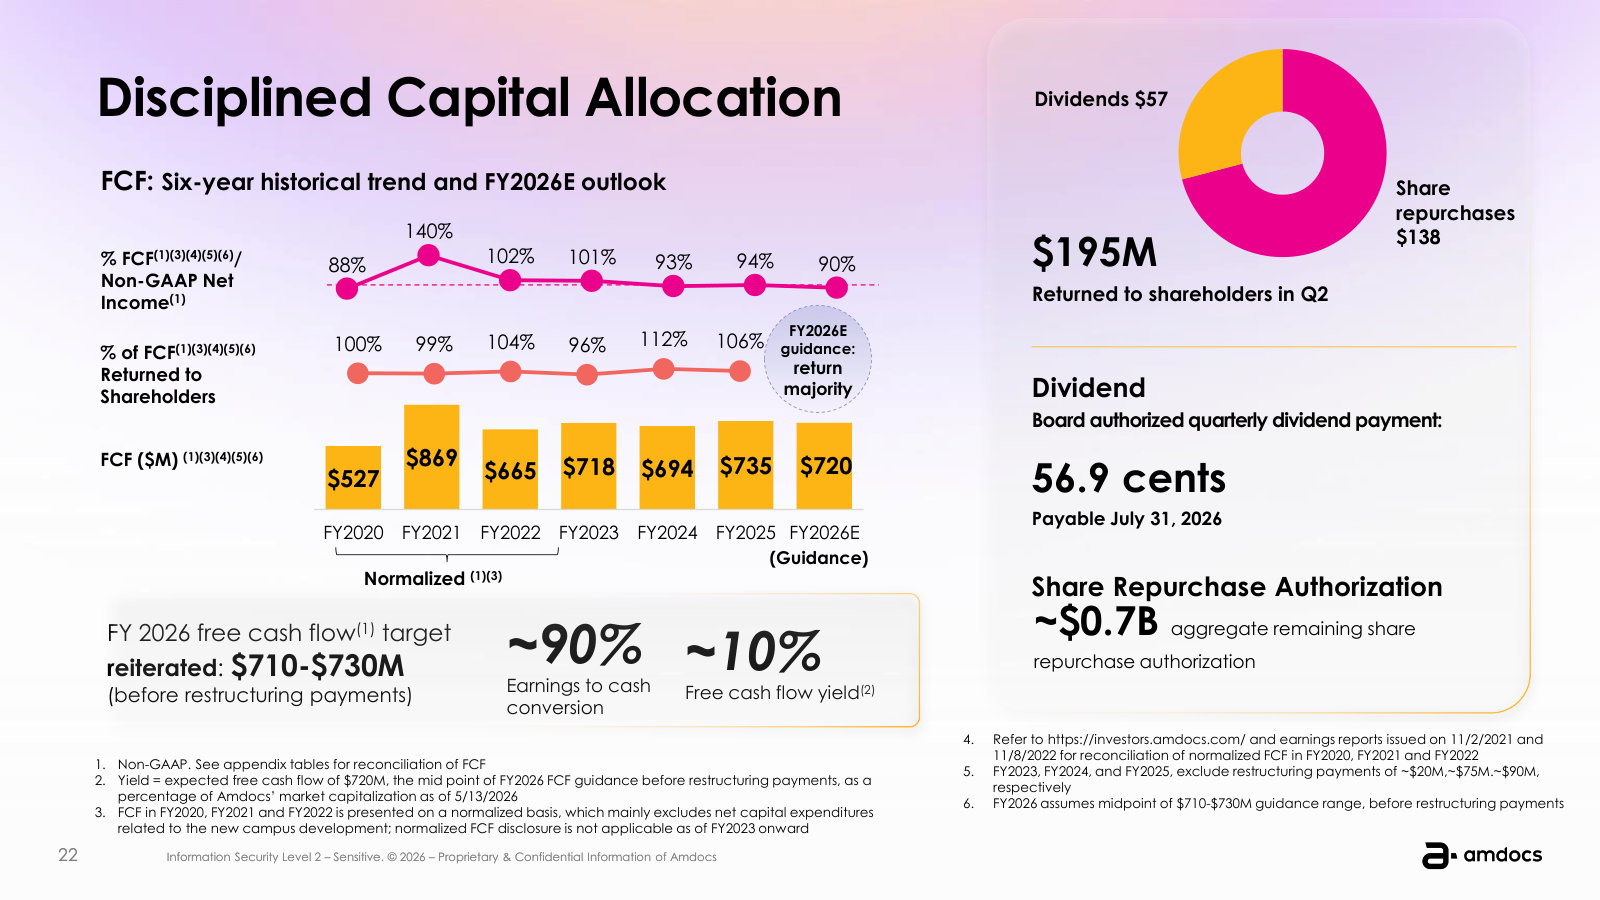
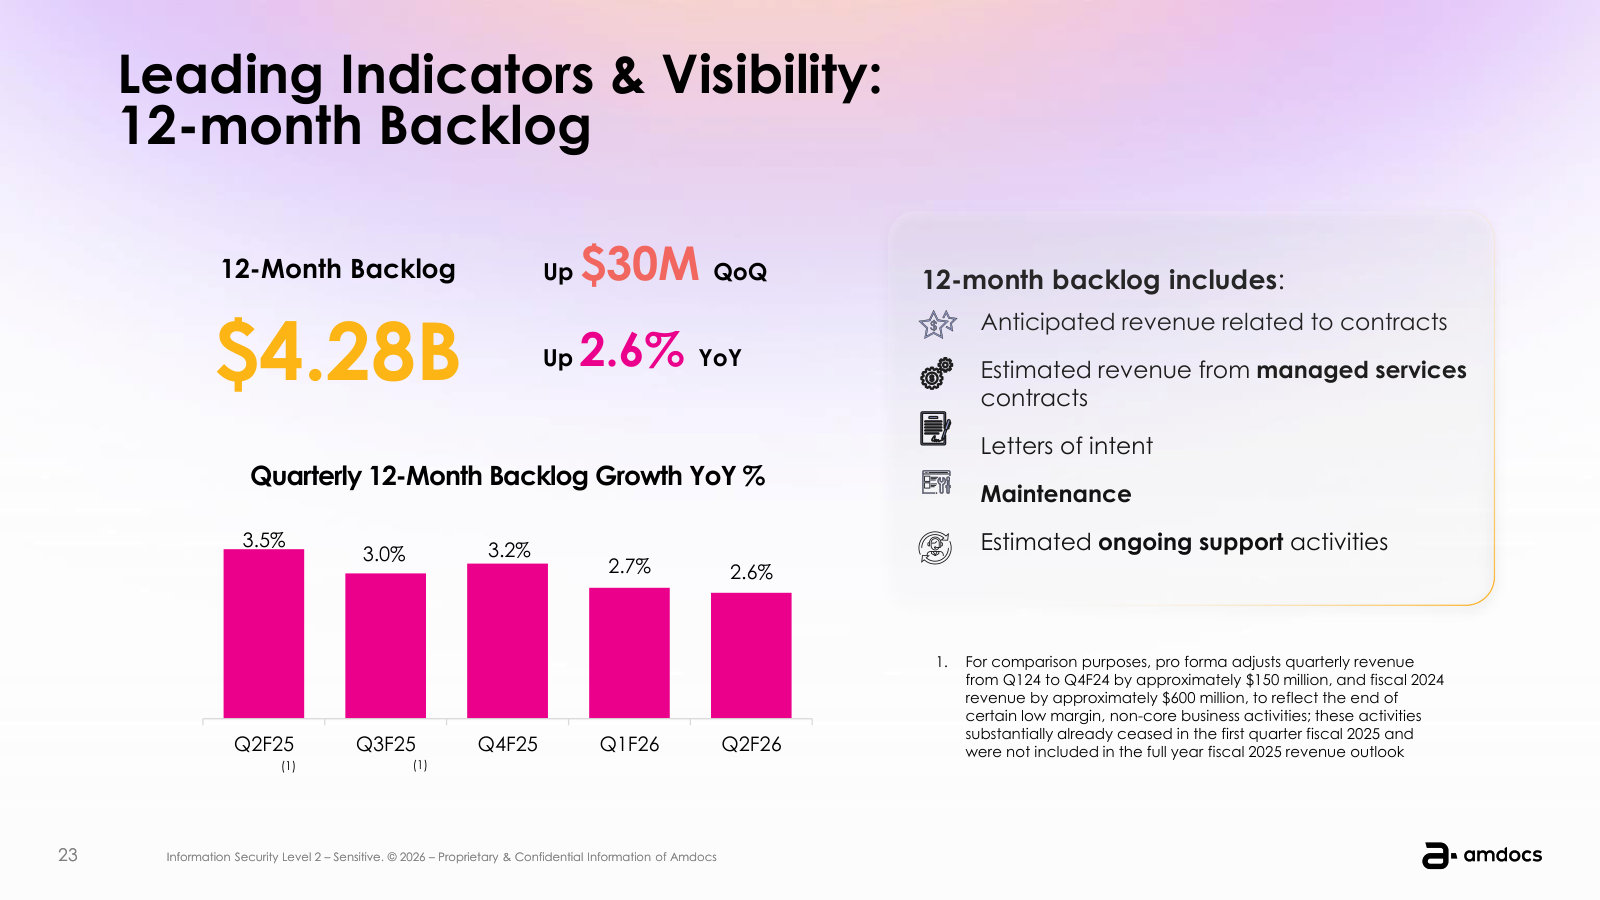
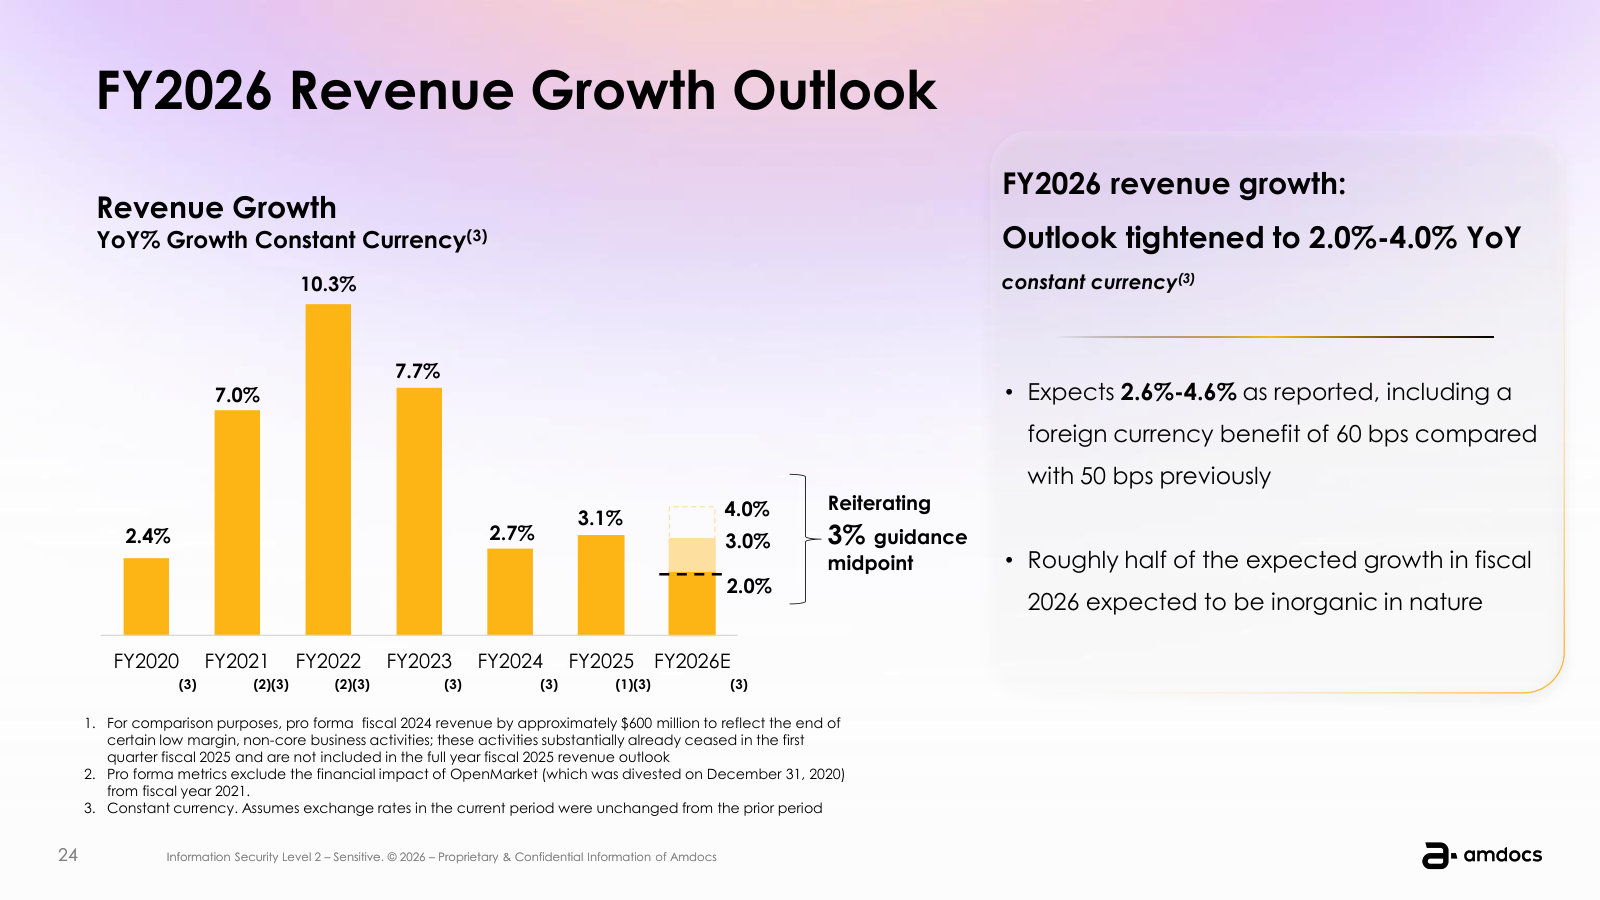
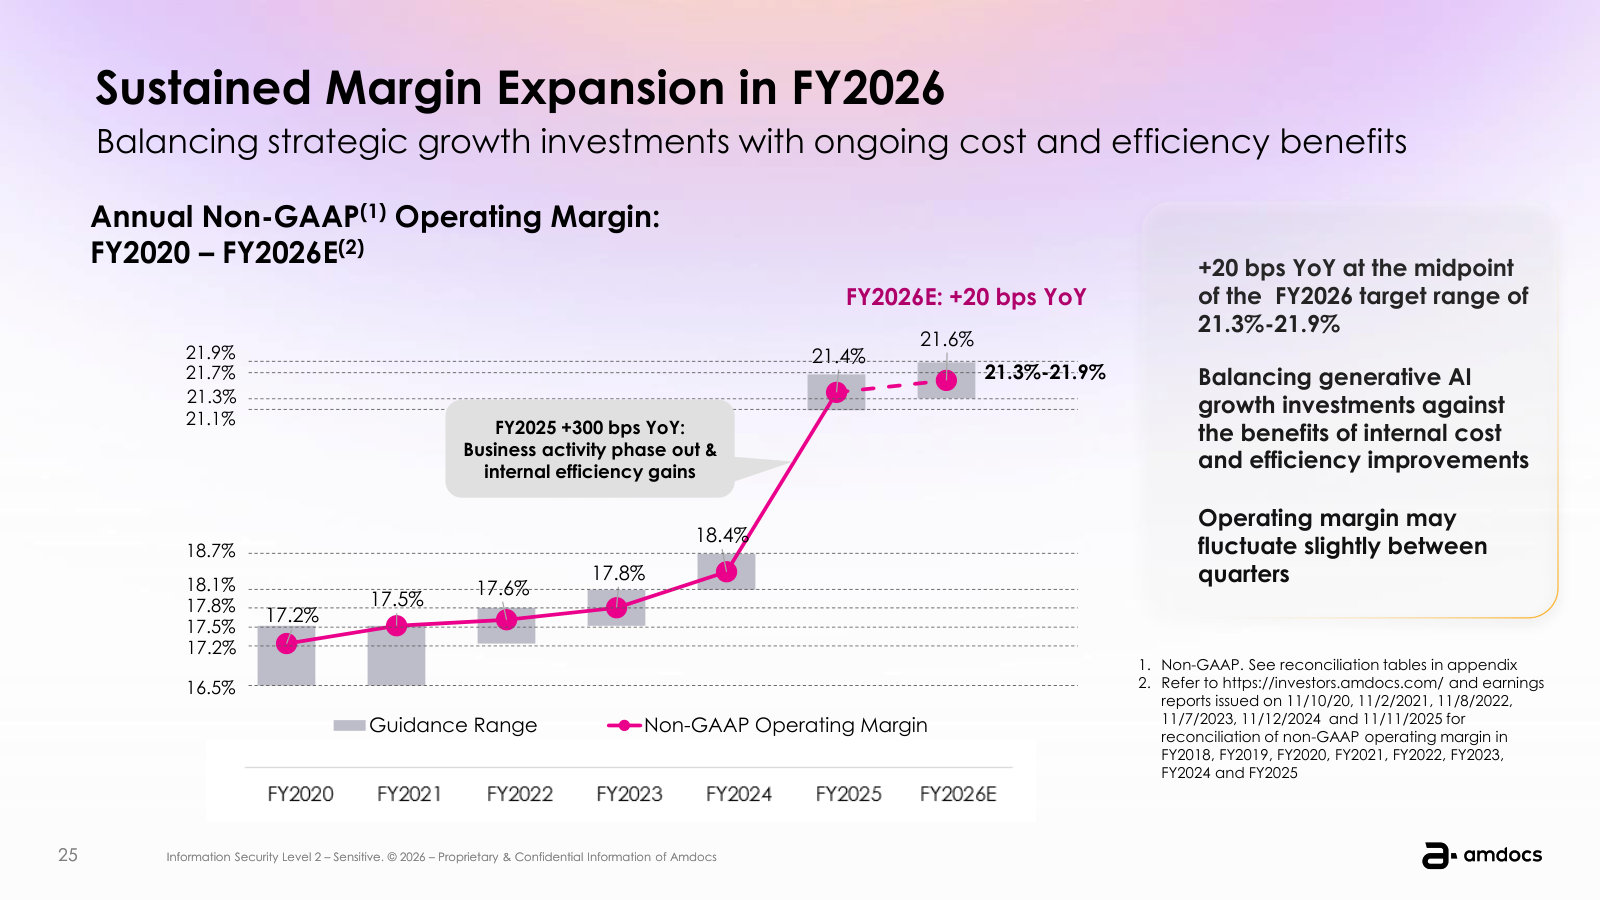
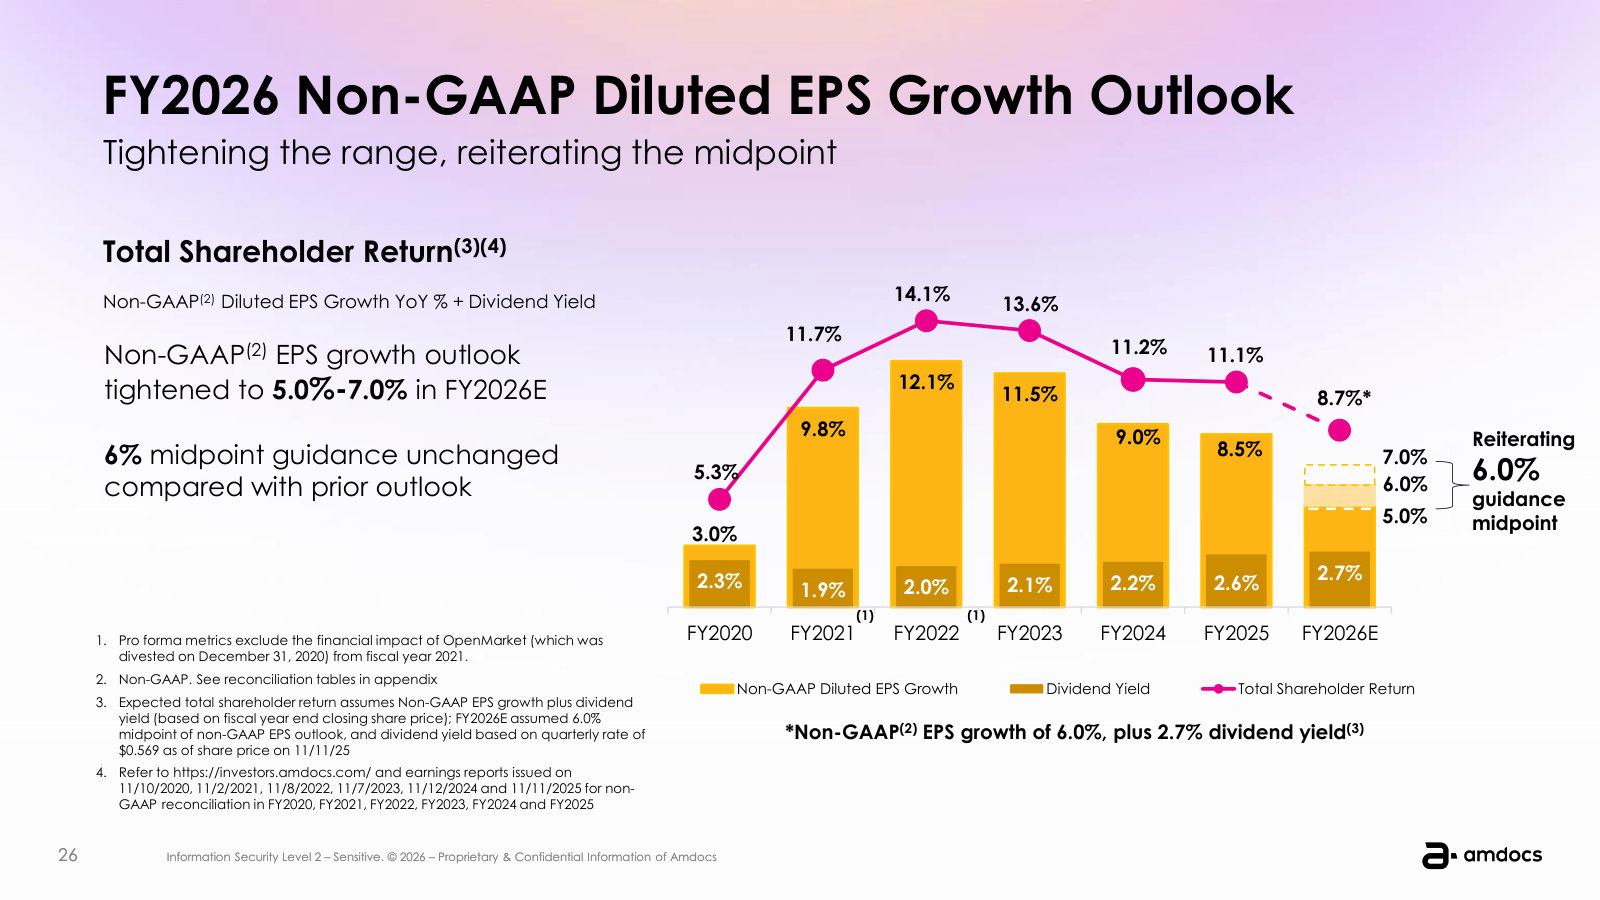
Fourth Quarter & Full Year Fiscal 2025 Investor Presentation — Q4 & FY2025
The fullest walk through the business — the five-pillar strategy, each growth domain, the product architecture and the recurring model. · Open the full document →
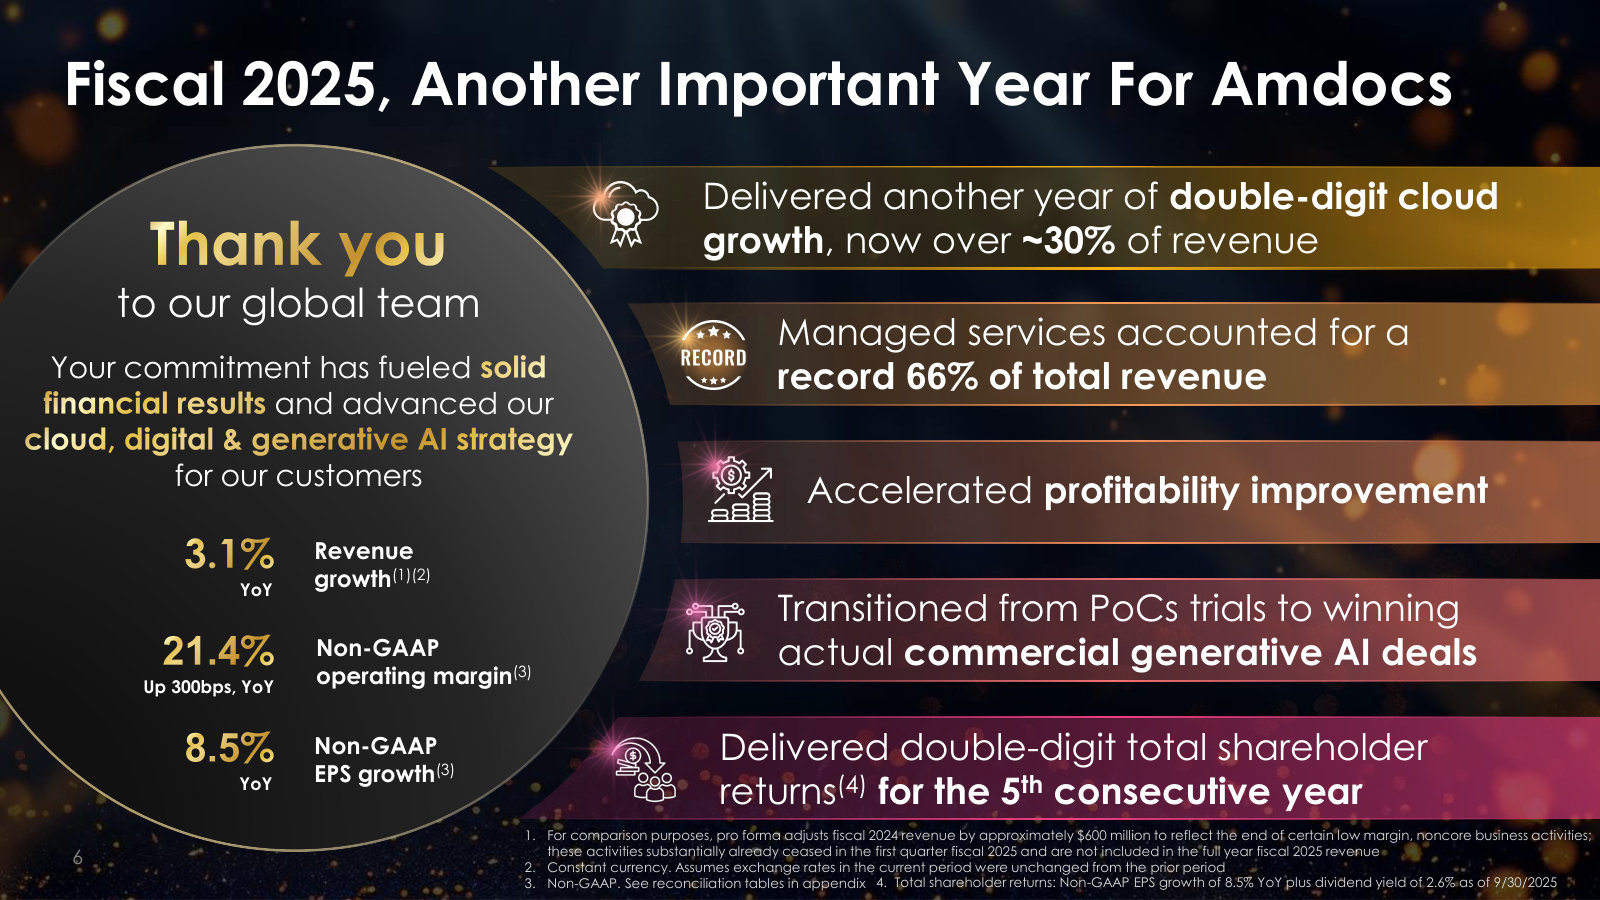
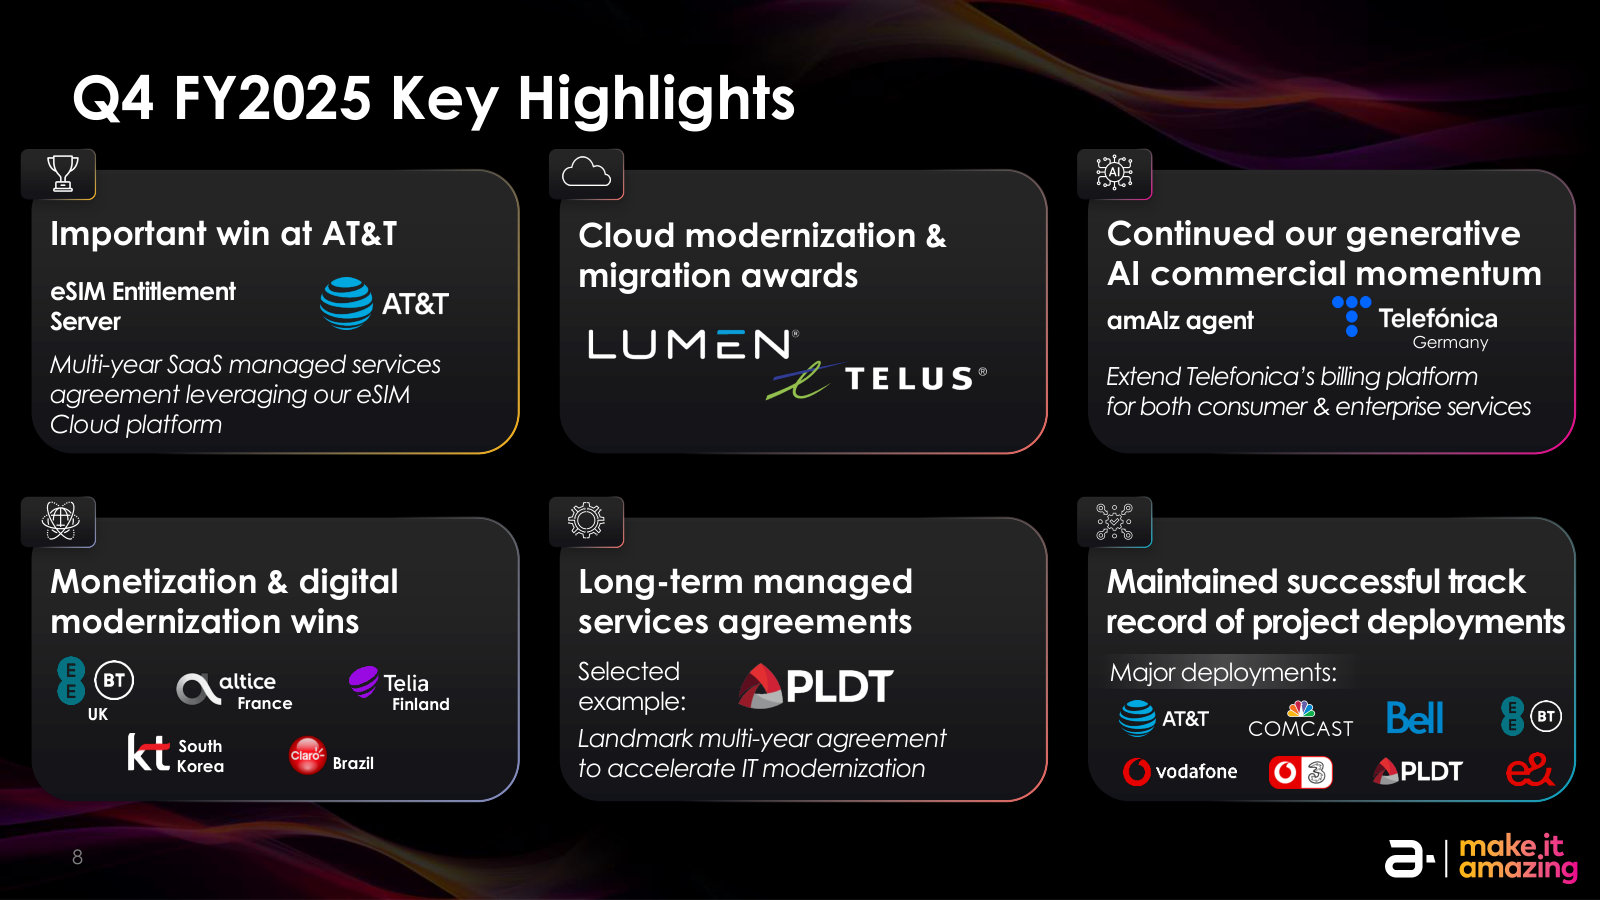
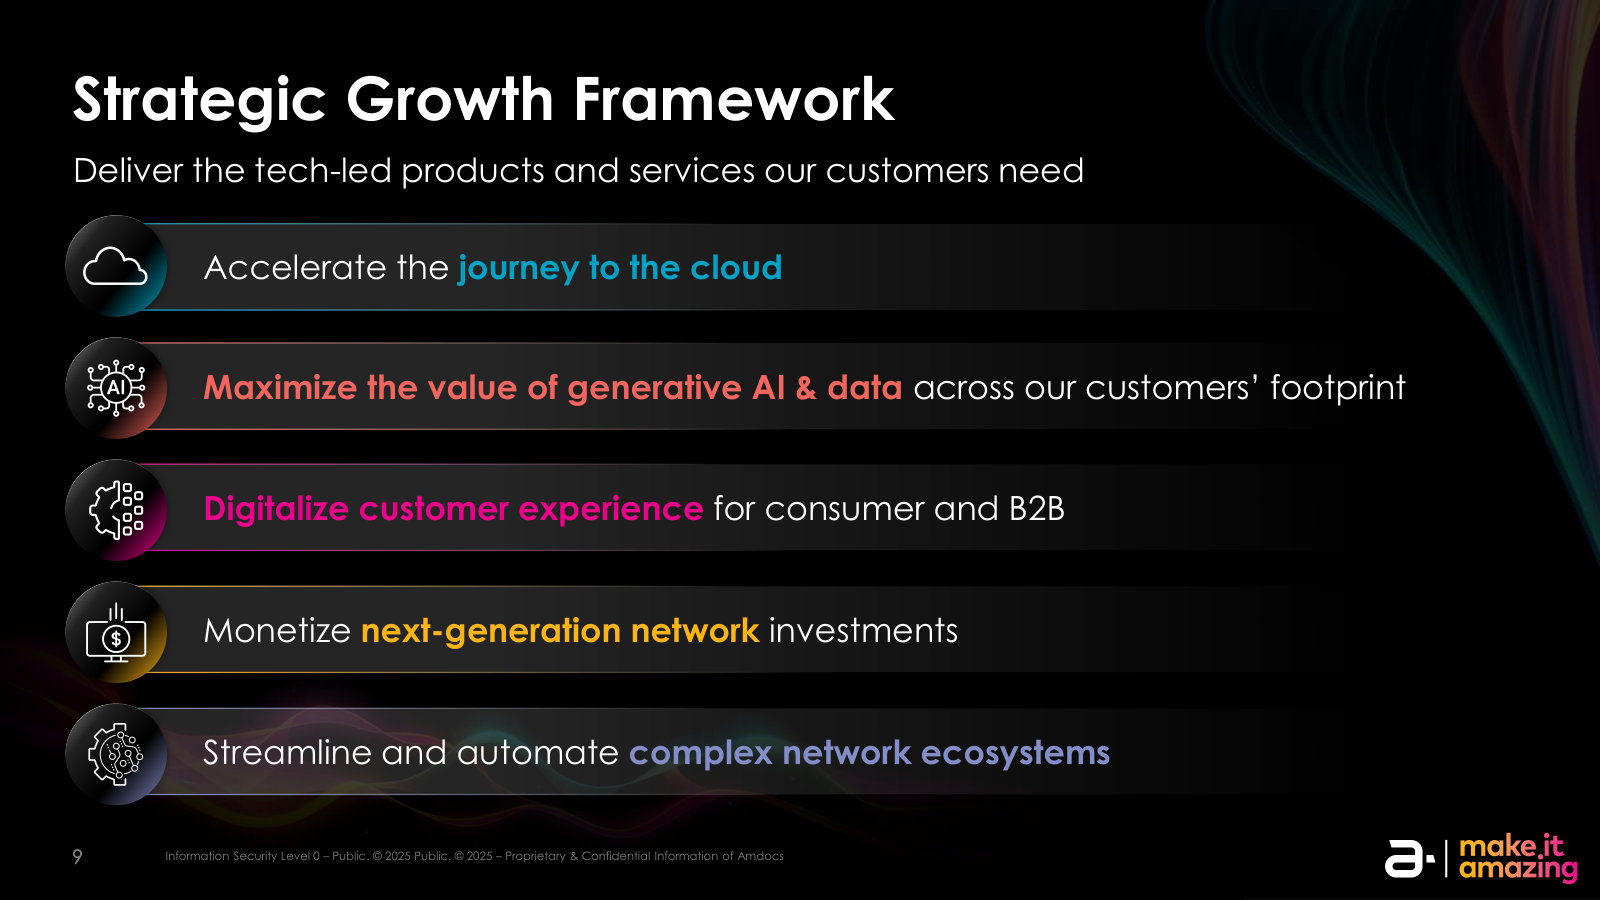
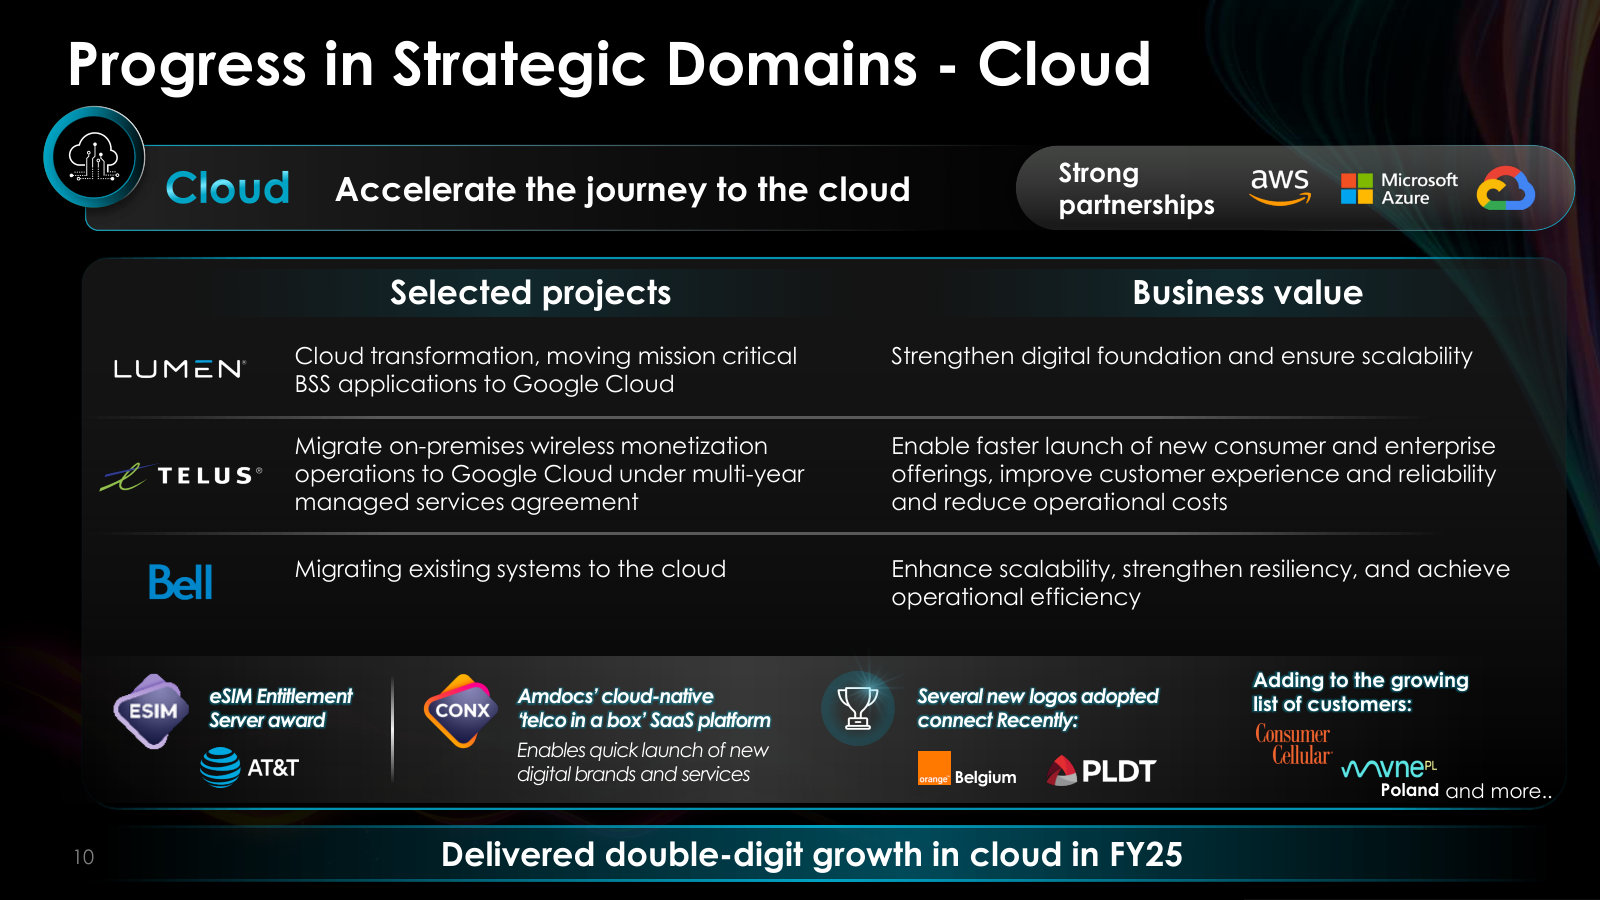
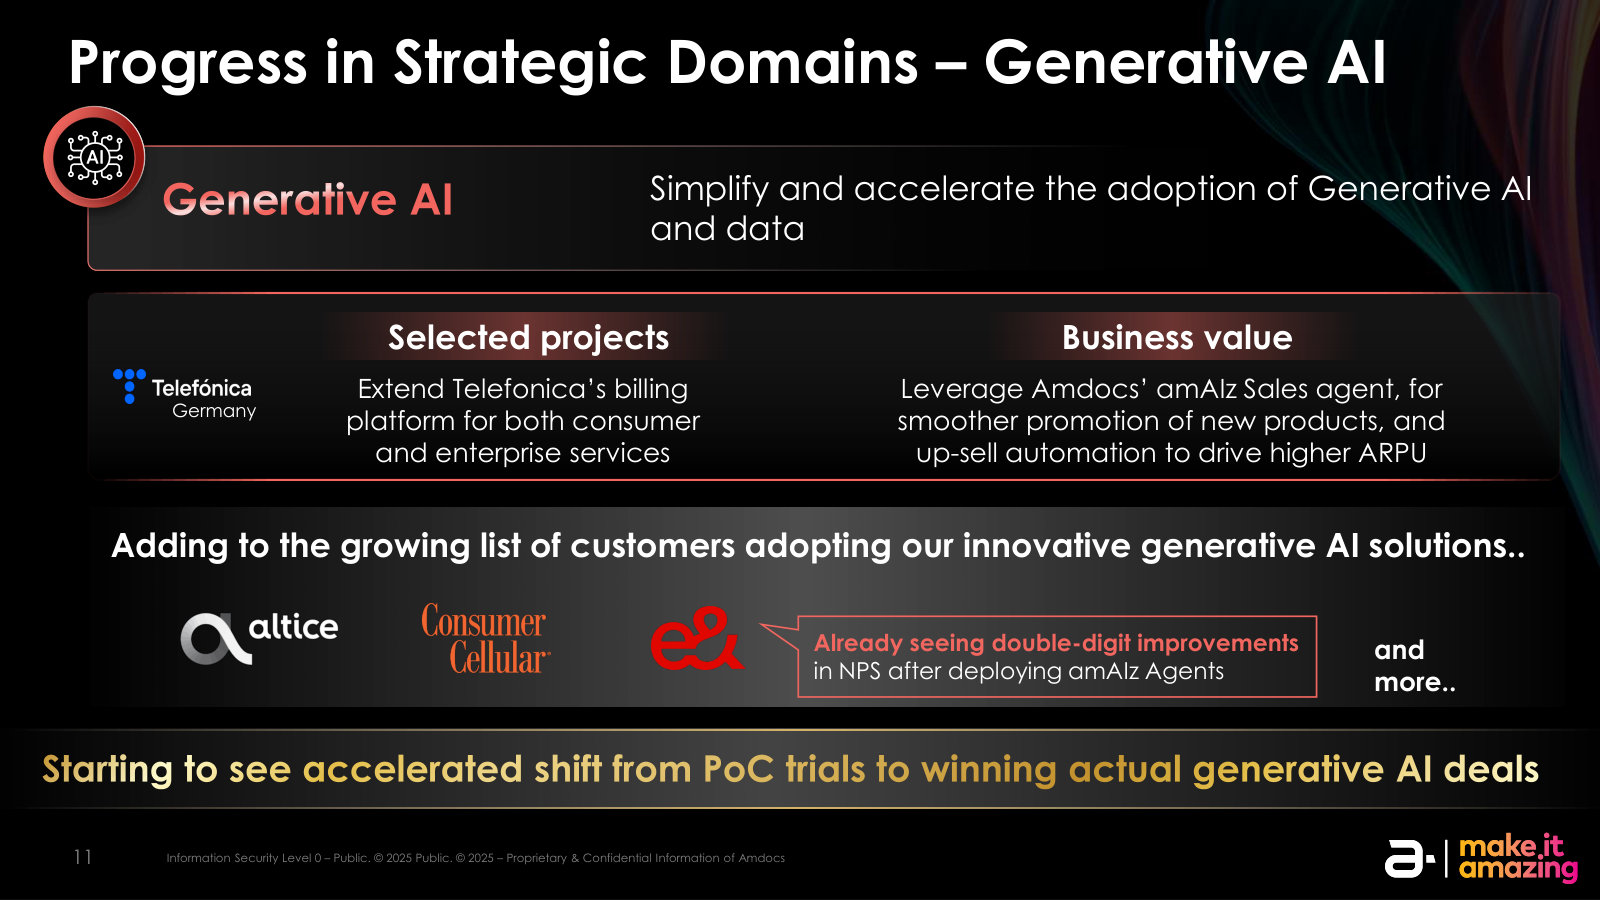
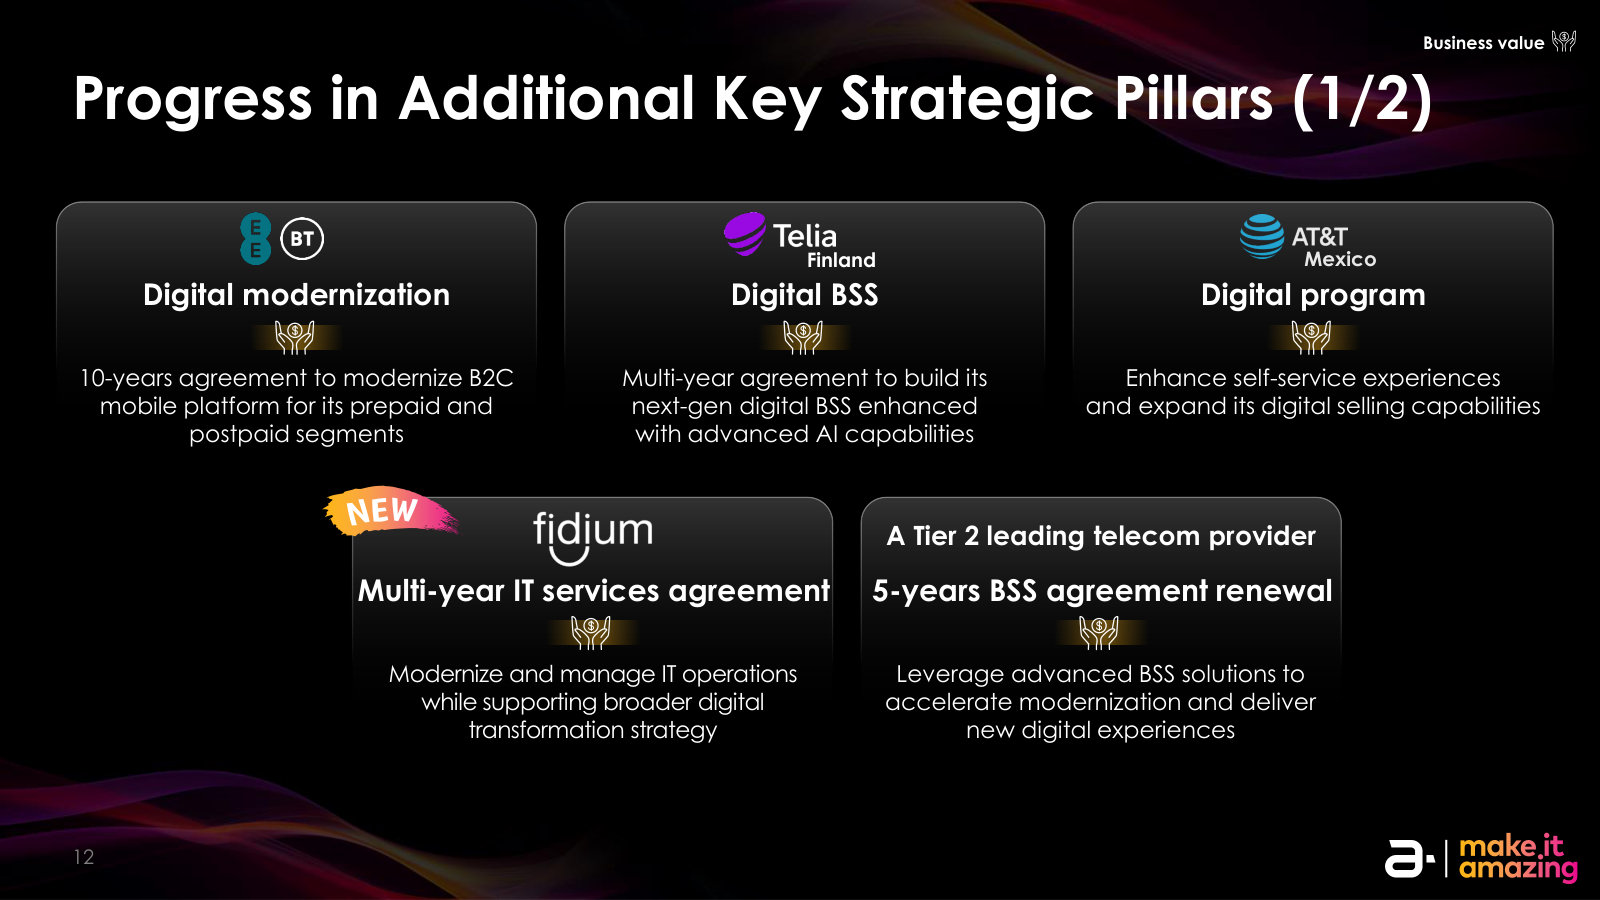
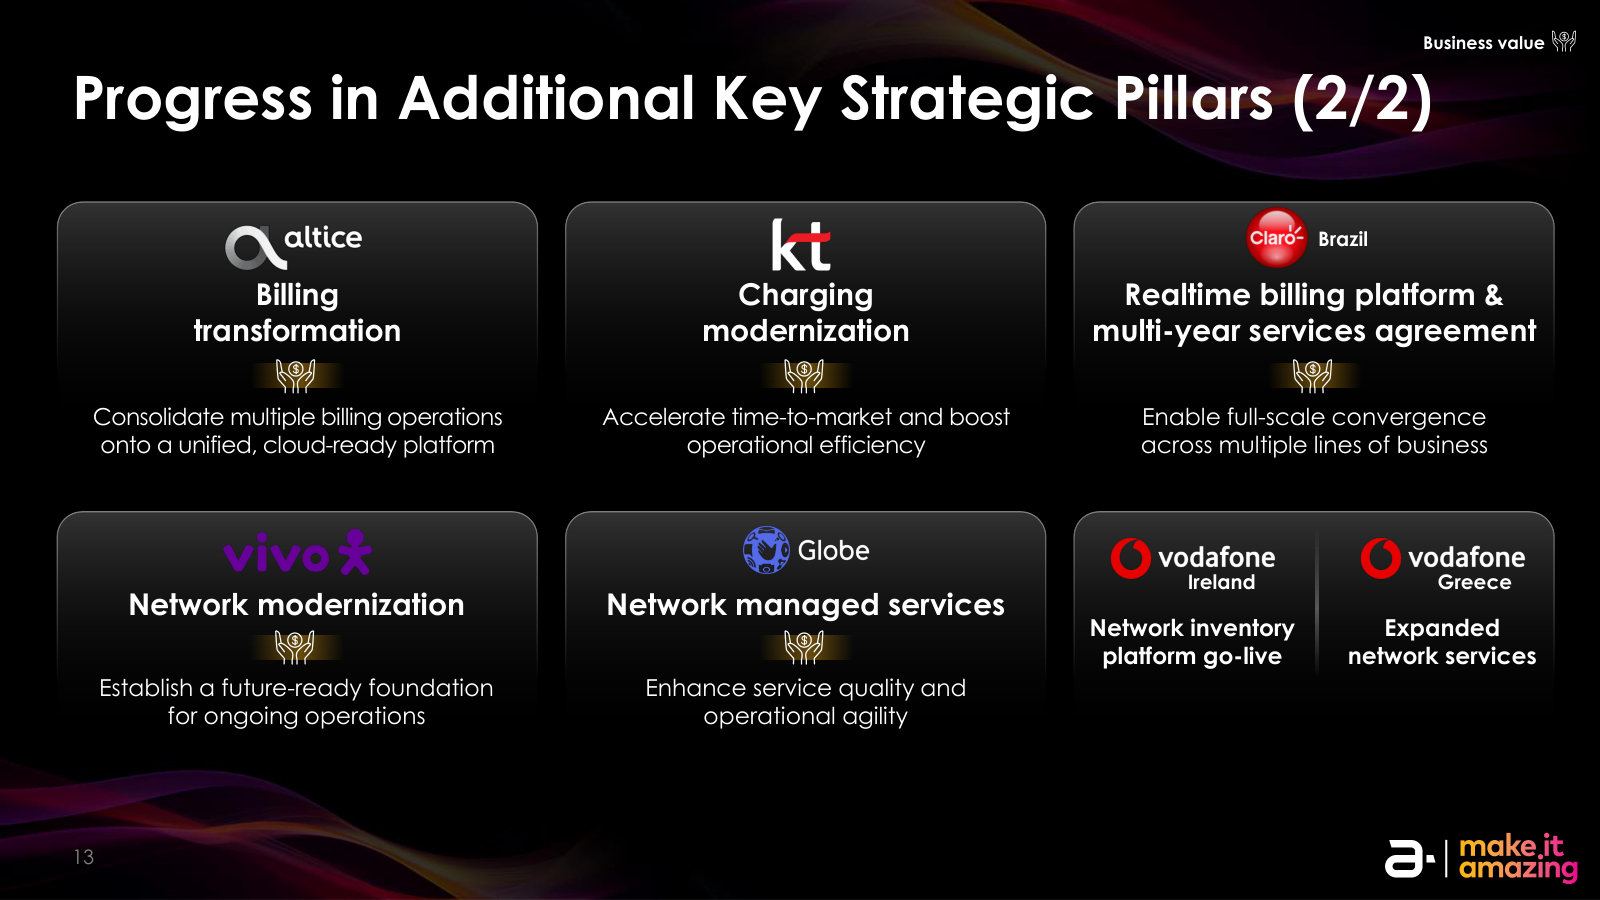
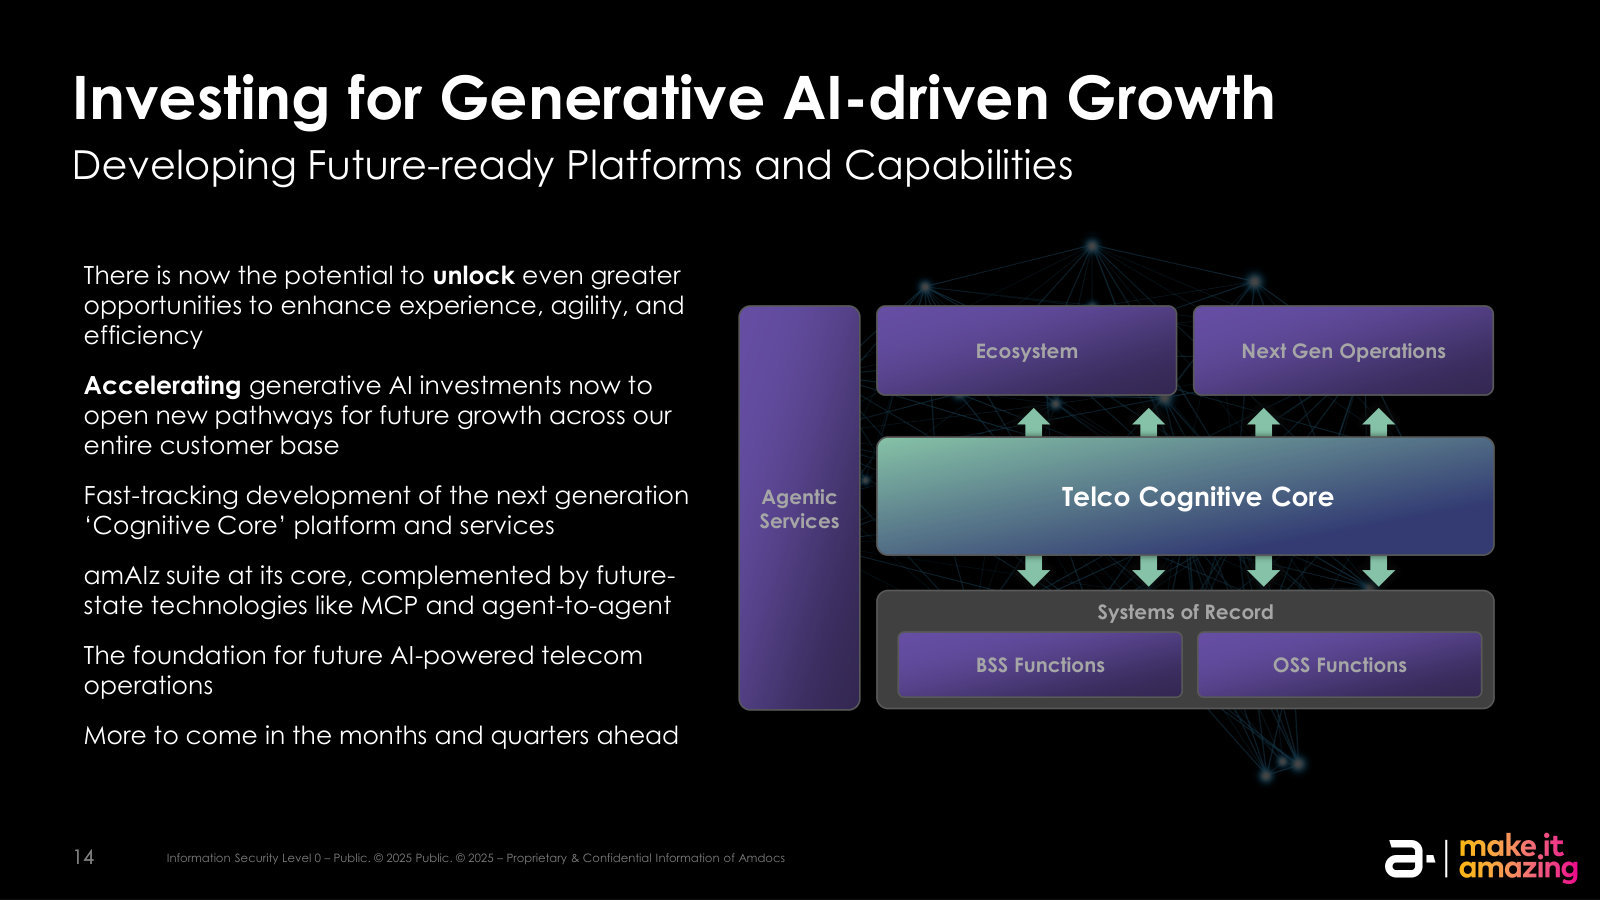
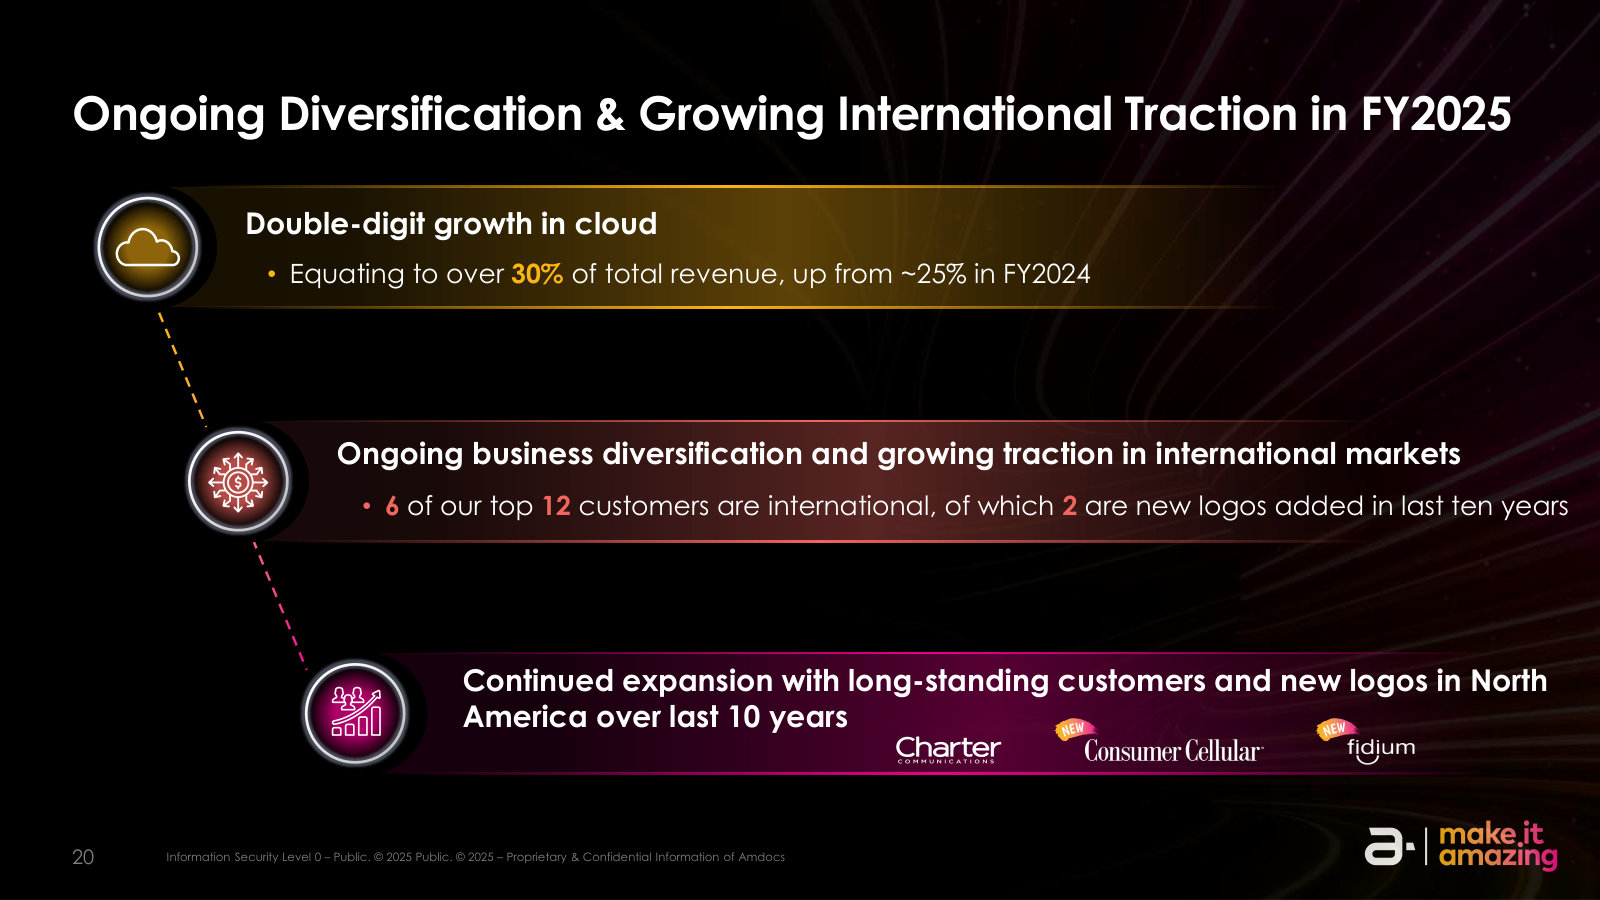
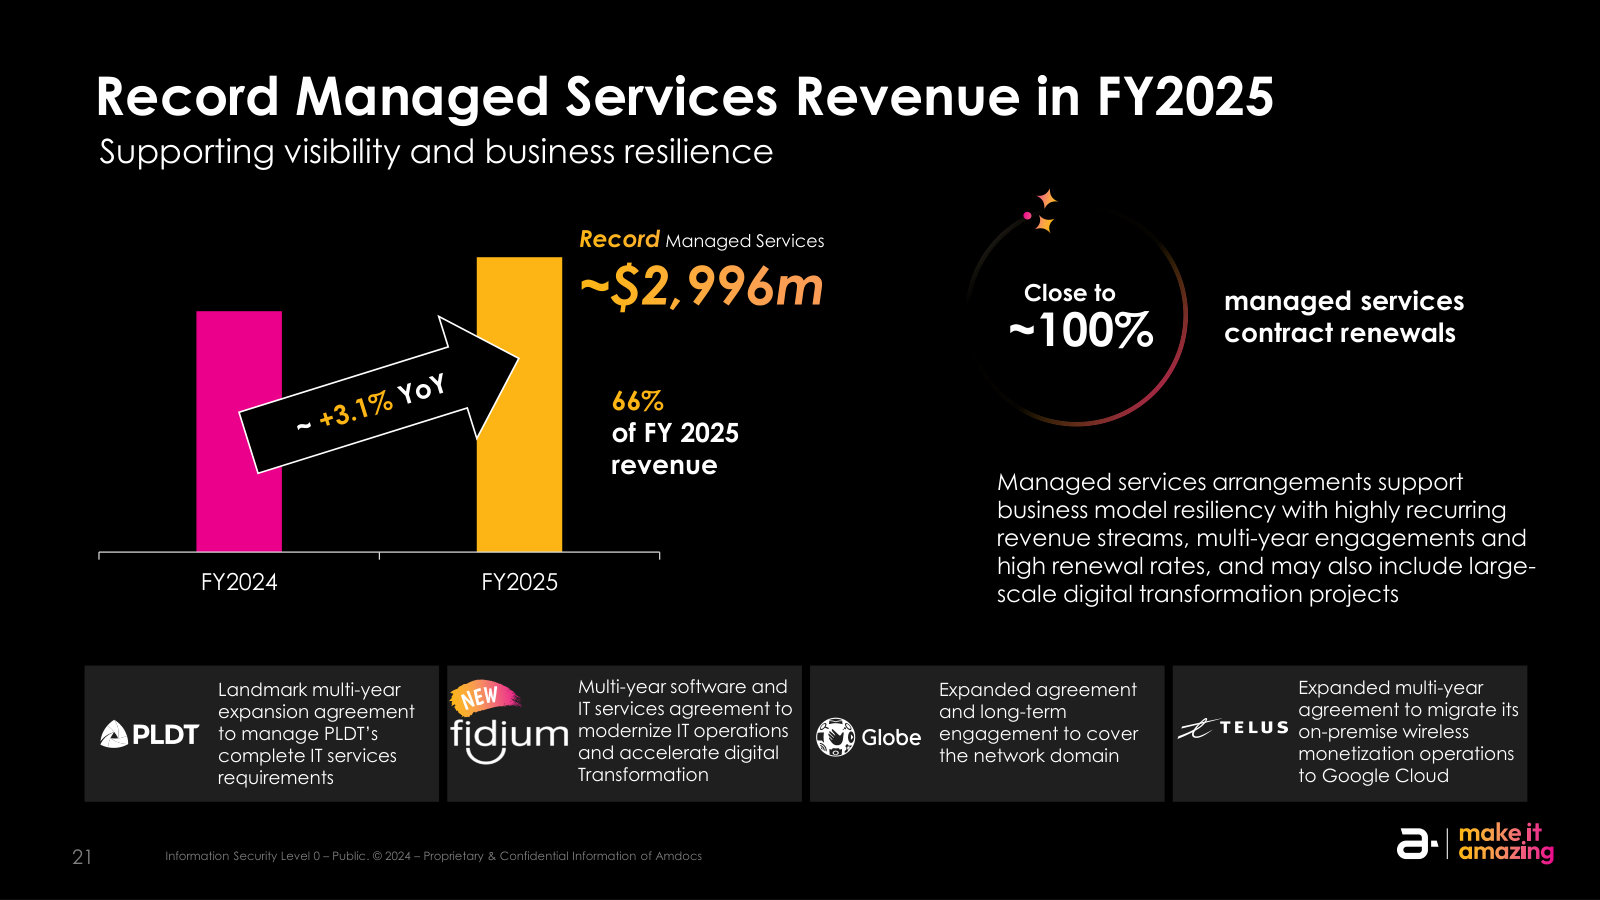
More from management
First Quarter Fiscal 2026 Investor Presentation — Q1 FY2026 · 30 pages · The transition quarter around the CEO change — the bridge between the FY2025 framework and the Q2 agentic relaunch. · Open →
Fourth Quarter & Full Year Fiscal 2024 Investor Presentation — Q4 & FY2024 · 34 pages · The prior full-year deck — the FY2024 baseline (cloud ~25%, pre-restructuring) the FY2025 story builds on. · Open →
Amdocs Limited's management answers for the business every quarter. These are the exchanges that explain it best — verbatim, from the call transcripts preserved in Sources. Each link opens the full transcript at that page in a new tab.
Q2 FY2026 Earnings Call — Q2 FY2026
First full quarter under new CEO Shimie Hortig: the GenAI-native strategy and AOS commercialization, plus the CFO succession, against a steady-model backdrop. · Open the full transcript →
The new CEO's pivot: AOS, a GenAI-native operating system for telco, moves from launch to early commercial deals.
Shimie Hortig (President & CEO): At Mobile World Congress last quarter, we oficially launched AOS, Amdocs' GenAI-native operating system purpose built for telco. So far, we have received excellent feedback from the market
p. 7 · Read in context →
The leading indicator and the demand behind it: 12-month backlog $4.28B, with expansions at AT&T Cricket, Vodafone Spain and KT.
Shimie Hortig (President & CEO): Overall, we closed the quarter with a 12-month backlog of $4.28 billion up $30 million sequentially and 2.6% from a year ago. Beyond the already mentioned AOS wins, this quarter we secured several significant deals which demonstrate wide ranging demand for our products and services.
And the confidence customers have in Amdocs. slide 13 highlights many of these deal wins but here are a few examples. In AT&T Cricket Wireless, we signed an expanded multi year extension of our managed services agreement including dealer onboarding modernization to enhance partner experience and drive faster market expansion. In Vodafone Spain, We secured a 5-year agreement covering CRM and OSS modernization alongside long term support and enhancement services. And in South Korea, KT, has extended its multi year agreement with Amdocs to upgrade, modernize, and operate its charging system empowering faster service rollout, and advanced 5G monetization.
p. 8 · Read in context →
A second leadership change lands the same quarter: the long-serving CFO announces her retirement.
Tamar Rapaport-Dagim (CFO & COO, retiring): Thank you, Shimie, for your kind words, and hello to everybody on the call today. Amdocs indeed has been a family to me. But as Shimie said, I have decided to retire and finally take some time for myself.
p. 11 · Read in context →
Why the model is resilient: managed services held ~65% of revenue with high renewal rates.
Tamar Rapaport-Dagim (CFO & COO): managed services revenue of $759 million was up 1.6% from the prior year in the second fiscal quarter. As a share of total revenue, managed services accounted for roughly 65%, consistent with the last several quarters. Renewal rates remain typically high during Q2, underpinning our business resiliency as we signed expanded multiyear engagements, with multiple customers.
p. 12 · Read in context →
Pressed by Liani on what a sub-100-day CEO changes, Hortig frames the thesis as closing a gap between AI's potential and telco adoption.
Shimie Hortig (President & CEO); Tal Liani (Bank of America): As you know, as of today, there is a major gap between the technology and the potential and the actual adoption that we see among our customers in general in enterprise software and customers around the world. So we believe that Amdocs, with our deep knowledge on this industry, with our capability to transform organization to move through technological shifts position us as the best partner that can take them to this future.
p. 16 · Read in context →
Q1 FY2026 Earnings Call — Q1 FY2026
The pivotal call: CEO succession announced, a renewed T-Mobile mega-relationship, the Matrix acquisition, and the AOS platform unveiled. · Open the full transcript →
The quarter's headline win: a new multiyear T-Mobile agreement spanning managed services, development and AI.
Shuky Sheffer (President & CEO): First, I am proud to announce that we signed a new multiyear agreement with T-Mobile that includes managed services, software development, and AI innovation. Under the new agreement, T-Mobile and Amdocs will collaborate to support T-Mobile's growth strategy and business objectives.
p. 6 · Read in context →
How Amdocs buys growth: the $197M Matrix deal consolidates billing/charging and adds a tier-one customer base.
Shuky Sheffer (President & CEO): Additionally, I'm excited to report that we closed the acquisition of Matrix Software for $197 million in cash at the end of Q1. Based in California, Matrix is a strategic consolidation move which complements and extends our leading market position around the core of billing, monetization, and charging solutions. […] These customers include major tier-one service providers such as Verizon, Telus, Telefonica, Swisscom, Three, Virgin Media O2, and Telstra, as well as a growing list of many smaller field operators and MVNOs.
p. 7 · Read in context →
The succession is announced: Sheffer to retire March 31, 2026, with an internal successor stepping up.
Shuky Sheffer (President & CEO); Shimie Hortig (incoming President & CEO): This planned succession reflects the depth of talent within Amdocs' management team and ensures continuity in our strategic direction. […] I'm excited to lead Amdocs into the next chapter. During my career at Amdocs across different leadership roles, I've come to appreciate what makes Amdocs a leader: our people and culture, our customer trust, and our technology innovation. As we look ahead, Amdocs is well-positioned to combine emerging technologies with deep domain expertise to drive value to customers and shareholders.
p. 12 · Read in context →
Q4 & Full-Year FY2025 Earnings Call — Q4 FY2025
Sheffer's last full-year framing: the recurring managed-services model at record scale, cloud maturing as the first growth engine, and the deliberate GenAI investment bet. · Open the full transcript →
The strategy inflection: Amdocs accelerates GenAI spend and fast-tracks a 'cognitive core' platform on top of MAGE.
Shuky Sheffer (President & CEO): To fully capture this potential for Amdocs and for our customers, we are accelerating our generative AI investment, which we expect will open new pathways for future growth across our entire customer base irrespective of the BSS/OSS version. This includes fast-tracking the development of what we call a cognitive core, a nextgeneration platform built on the solid foundation of Amdocs MAGE.
p. 8 · Read in context →
Sizing the opportunity and the caveat: a ~$60B serviceable market, watched against macro/spending uncertainty.
Shuky Sheffer (President & CEO): With our unique tech-led and outcome-based accountability model, Amdocs is strongly positioned within our serviceable addressable market of nearly $60 billion to monetize the rich pipeline of opportunities across cloud, data network, and generative AI and data. That said, we are closely watching for any impact of the uncertain global macroeconomic environment on us and our customers' demand and spending behavior.
p. 9 · Read in context →
Land-and-expand plus recurring revenue: Charter grew into a top-10 account and managed services hit a record $3B, 66% of revenue.
Tamar Rapaport-Dagim (CFO & COO): A great example is Charter, with which we had limited business a decade ago but is now one of our top 10 customers. […] managed services revenue was a record $3 billion in fiscal 2025, up 3.1% from a year ago. Managed services as a share of overall revenue also reached a new high of 66% in fiscal 2025, further strengthening our business resilience as we maintained high renewal rates and expanded our customer activities under long-term agreements.
p. 11 · Read in context →
The growth-ceiling question, answered: cloud is now ~30% of revenue; breaking above 3% needs GenAI as a second engine.
Tal Liani (Bank of America); Shuky Sheffer (President & CEO): when you look out you say where you want to position the company, the CEO, a few years down the road, do you think that what you're doing today and your activity in cloud and your activity in GenAI could it change the growth profile of the company? Meaning, can you grow sustainably above the current three to 4% going into new markets and new times. […] The answer will be shorter than the question, but I think in the last couple of years, the main growth engine for Amdocs was the cloud. And in order for us to break this 3% and to go to a mid-single digit that we would like to be, we need more than one growth engine. As big as it is, you know, it's become already 30%. So, we really believe that the investments we do in this unique offering we are going to have more than one significant engine like cloud, and we believe that what we develop right now in GenAI would be another one.
p. 21 · Read in context →
Q4 & Full-Year FY2021 Earnings Call — Q4 FY2021
The clearest baseline of how the business works: backlog as a leading indicator, the recurring managed-services model, near-100% cash conversion, and the 5G/cloud demand thesis. · Open the full transcript →
The starting point: 7% constant-currency growth and a record $3.7B 12-month backlog four-plus years before the leadership handoff.
Shuky Sheffer (President & CEO): We delivered excellent pro forma revenue growth of 7% in constant currency in fiscal year 2021, driven by healthy customer activity across North America, Europe and rest of the world. Our sales momentum continued through the fourth quarter which ended up with a record 12-month backlog of $3.7 billion, up 10.5% from a year ago on a pro forma basis.
p. 6 · Read in context →
How to read Amdocs: the 12-month backlog runs ~80% of forward revenue, and managed services (~59%) supply the recurring base.
Tamar Rapaport-Dagim (CFO & COO): 12-month backlog has traditionally serves as a good leading indicator of our business, having consistently averaged around 80% of forward-looking 12 months revenue over the years. Q4 was also a healthy quarter for Managed Services, where revenue grew from a year ago, equating to roughly 59% of total revenue. Our multiyear managed services engagements underpin the resiliency of our business with recurring revenue streams, high renewal rates and expanded activities with existing customers, including into next-gen cloud operations.
p. 10 · Read in context →
The unit-economics anchor: over time, expect earnings to convert to cash roughly at par (~100%).
Maxwell Osnowitz (Stifel); Tamar Rapaport-Dagim (CFO & COO): So unfortunately, I have not found yet the patent to convert over time, more cash than earnings. And seriously, I think that over time, you should expect us to convert at par, meaning 100%.
p. 16 · Read in context →
Is the demand durable or COVID catch-up? Management ties it to multiyear 5G/cloud transformations in 'early innings'.
Tal Liani (Bank of America); Shuky Sheffer (President & CEO): The growth acceleration we're seeing this year, we're seeing growth acceleration across companies who sell to carriers and cloud and I want to understand the longevity, the sustainability of the growth acceleration, meaning can you discuss whether this is – these are just projects that maybe were on hold during COVID or anything that was delayed and now being deployed versus projects who are starting on long-term cyclings you have done and translate into long-term growth? […] Definitely, these megatrends are here to stay for several years. And by the way, all these projects are like a multiyear projects. I mean to transform companies in the size of T-Mobile, AT&T, Vodafone, it takes years.
p. 17 · Read in context →
More calls
Q3 FY2025 Earnings Call — Q3 FY2025 · 22 pages · The last pre-succession quarter under Sheffer, tracking the ramp of GenAI proof-of-concepts toward commercial deals. · Open →
Q2 FY2025 Earnings Call — Q2 FY2025 · 21 pages · Mid-year FY2025 detail on managed-services renewals and the phase-out of low-margin non-core activity that lifted margins. · Open →
Q1 FY2025 Earnings Call — Q1 FY2025 · 24 pages · Where the FY2025 guidance framework and early GenAI/cloud momentum were first laid out. · Open →
Q4 & Full-Year FY2024 Earnings Call — Q4 FY2024 · 29 pages · The FY2024 wrap and original FY2025 targets, plus the reshaping toward higher-margin core business. · Open →
Q3 FY2023 Earnings Call — Q3 FY2023 · 24 pages · Early framing of the generative-AI opportunity and the MAGE/data platform in the telco context. · Open →
Q1 FY2022 Earnings Call — Q1 FY2022 · 31 pages · A clean early-window explanation of the cloud/5G transformation cycle and the managed-services mix. · Open →
Q3 FY2021 Earnings Call — Q3 FY2021 · 30 pages · The earliest call in the set, on the post-pandemic acceleration and the 5G/cloud/digital growth pillars. · Open →
Amdocs Limited's annual reports contain management's most considered account of the business. These are the sections, passages and visual pages worth opening in the originals preserved in Sources.
Amdocs Limited — FY2025 Annual Report (Form 20-F) — FY2025 (year ended September 30, 2025)
Management's fullest account of a reset year: revenue down 9.4% as low-margin non-core work was phased out, yet operating margin jumped to 16.1%. · Open the full document →
Item 3. Key Information — Risk Factors — p. 6 · Read the full section →
The two risks most specific to Amdocs: extreme customer concentration and an Israel-centered operating footprint.
One of the largest development centers sits in Israel; the Oct-2023 war shows how regional conflict reaches operations.
Of the development centers we maintain worldwide, two of our largest development centers are located in India and one in Israel. In Israel, our facilities are located in several different cities, with our main facility in the center of the country. Less than 15% of our workforce is located in Israel, with revenue from customers in Israel comprising less than 1% of total revenue. As a result, we are directly influenced by the political, economic and military conditions affecting Israel and its neighboring regions. Any major hostilities involving Israel could have a material adverse effect on our business. […] On October 7, 2023, Hamas launched a terrorist attack on Israel, which has further evolved into an ongoing war with Hamas, and later on with additional terrorist organizations in the north of Israel. This has resulted in certain of our workforce shifting to remote work and some military reserve service call ups in Israel. Although a ceasefire agreement between Israel and Hamas was reached in October 2025, the situation continues to be volatile and could lead to additional hostilities in Israel and the Middle East, which might require additional business or operational adjustments, and may result in additional costs and potential disruptions to our operations.
p. 24 · Read in context →
Item 4. Information on the Company — p. 34 · Read the full section →
The business description in management's own words, plus the marquee-carrier roster that is the whole franchise.
What Amdocs is: software and services to ~400 communications, entertainment and media providers worldwide.
Amdocs is a leading provider of software and services for approximately 400 communications, entertainment and media industry and other service providers in developed countries and emerging markets. Our customers include some of the largest telecommunications companies in the world (including América Móvil, AT&T, Bell Canada, Singtel, Telstra, T-Mobile, Verizon Telefónica and Vodafone), as well as broadband, mobile and entertainment providers (including Charter Communications, Comcast, DISH, J:COM, Optimum, Rogers and Sky), small to midsized communications businesses and mobile virtual network enablers/mobil virtual network operators, satellite operators, and providers of media and other services, such as financial services.
p. 36 · Read in context →
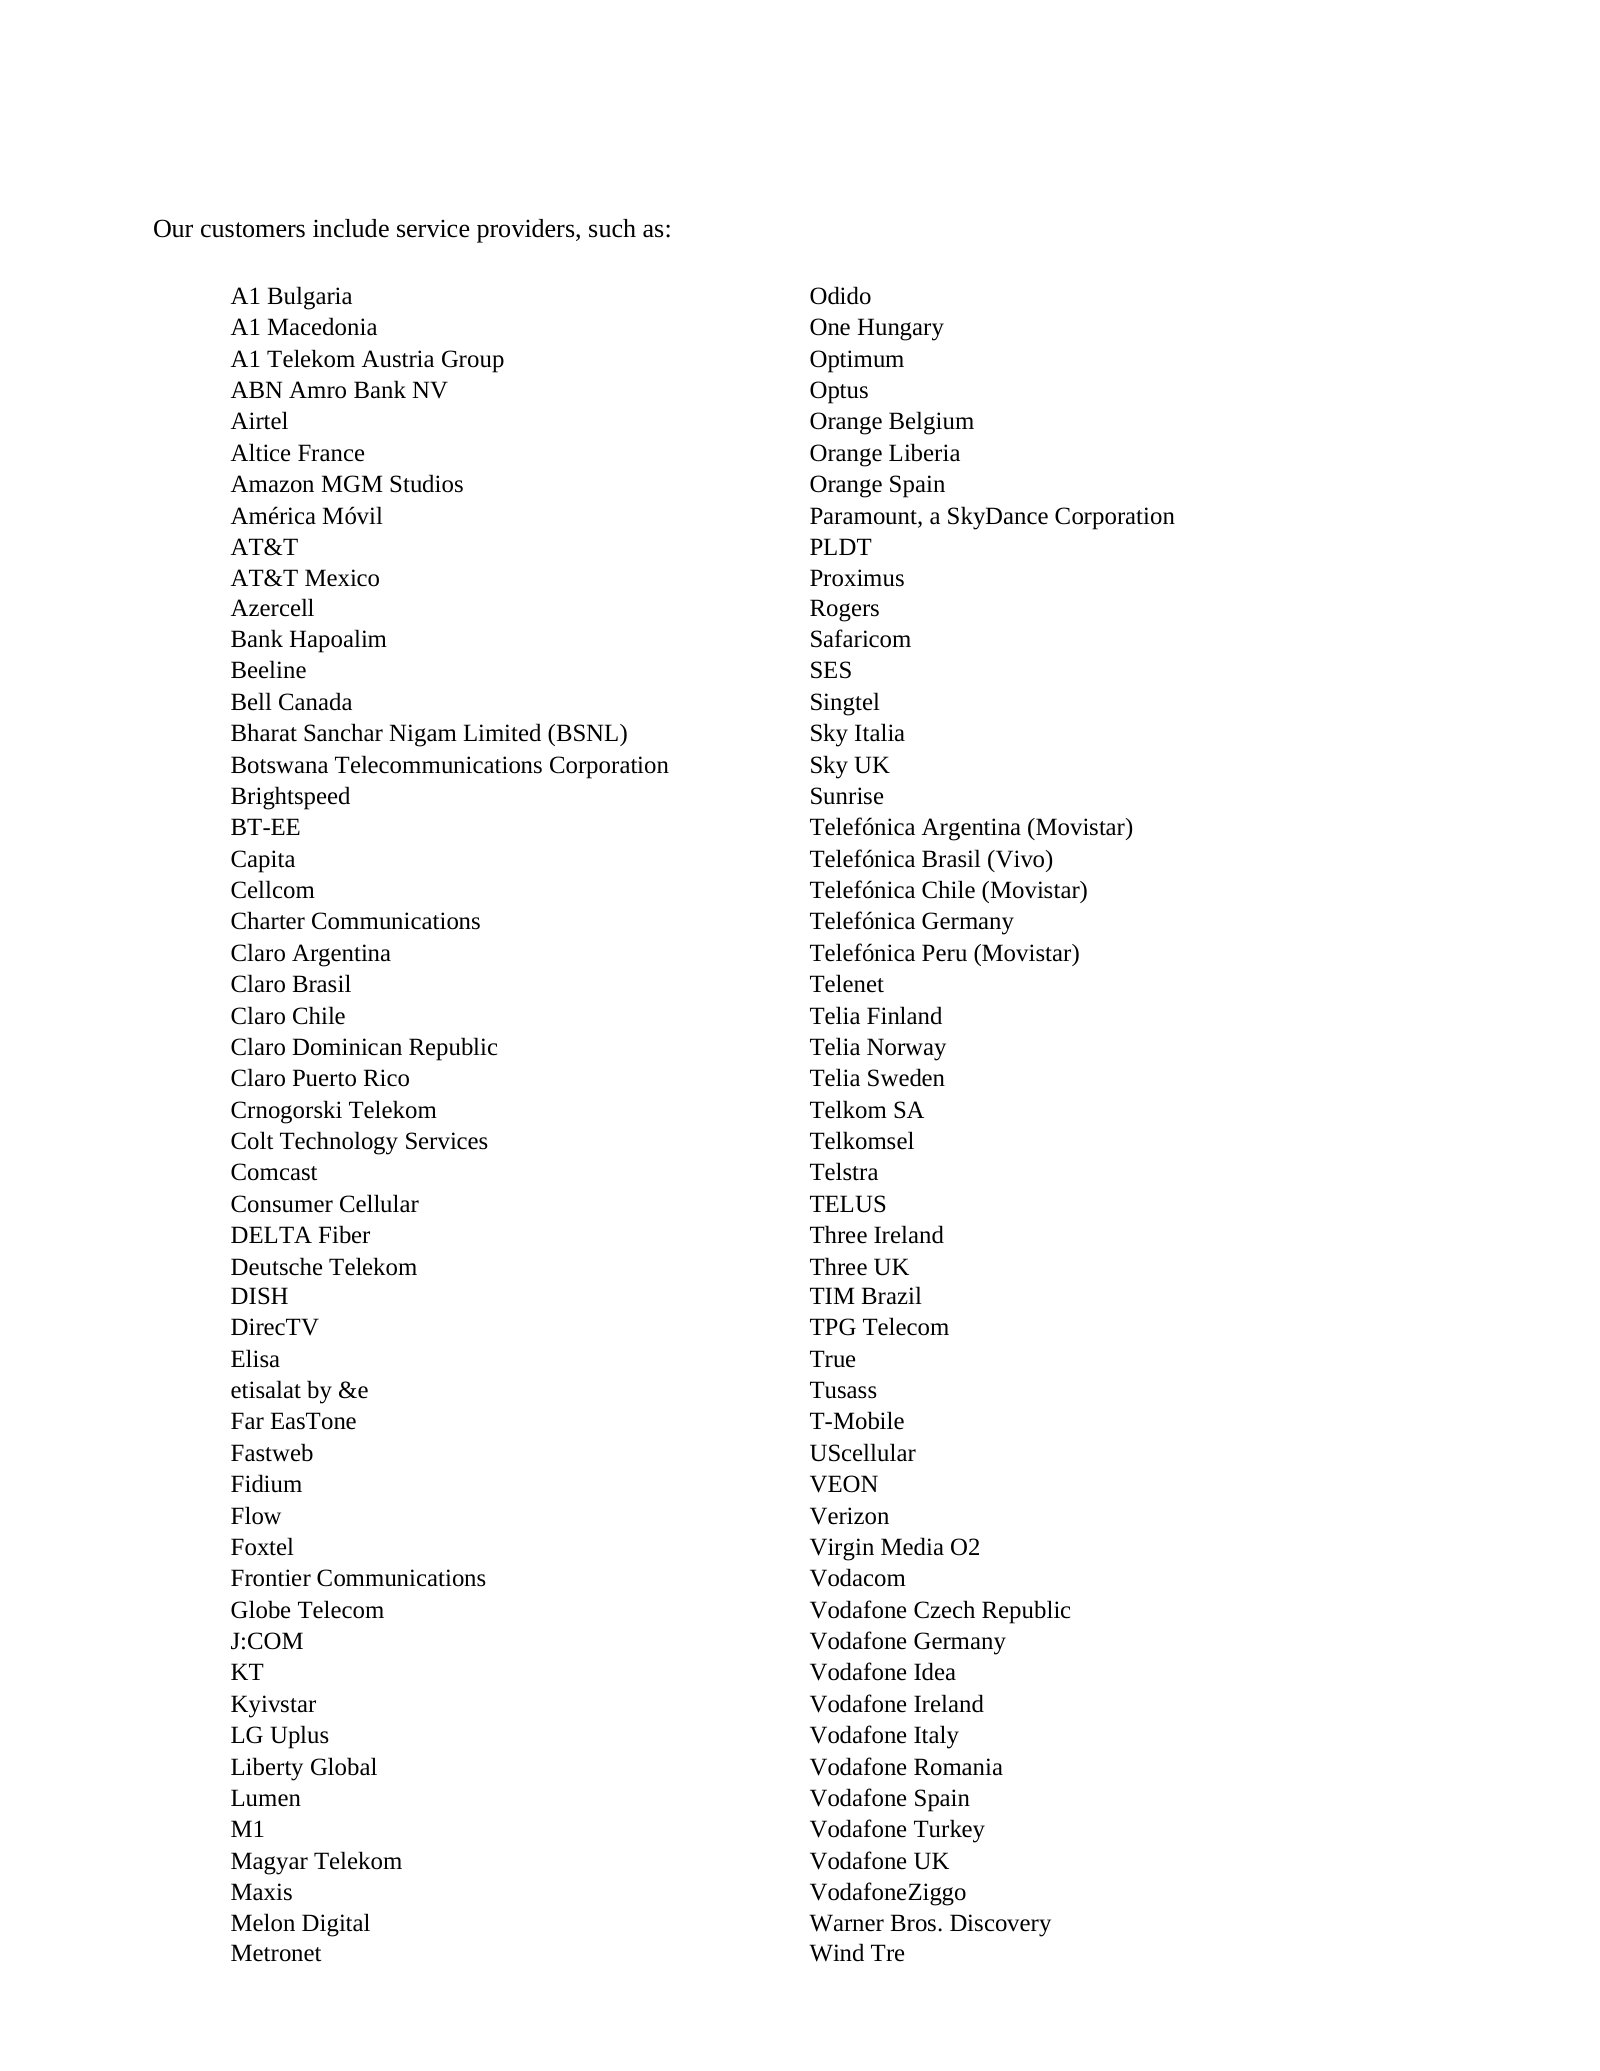
Item 5. Operating and Financial Review and Prospects — p. 56 · Read the full section →
Where management explains the paradox of the year: headline revenue fell while profitability rose.
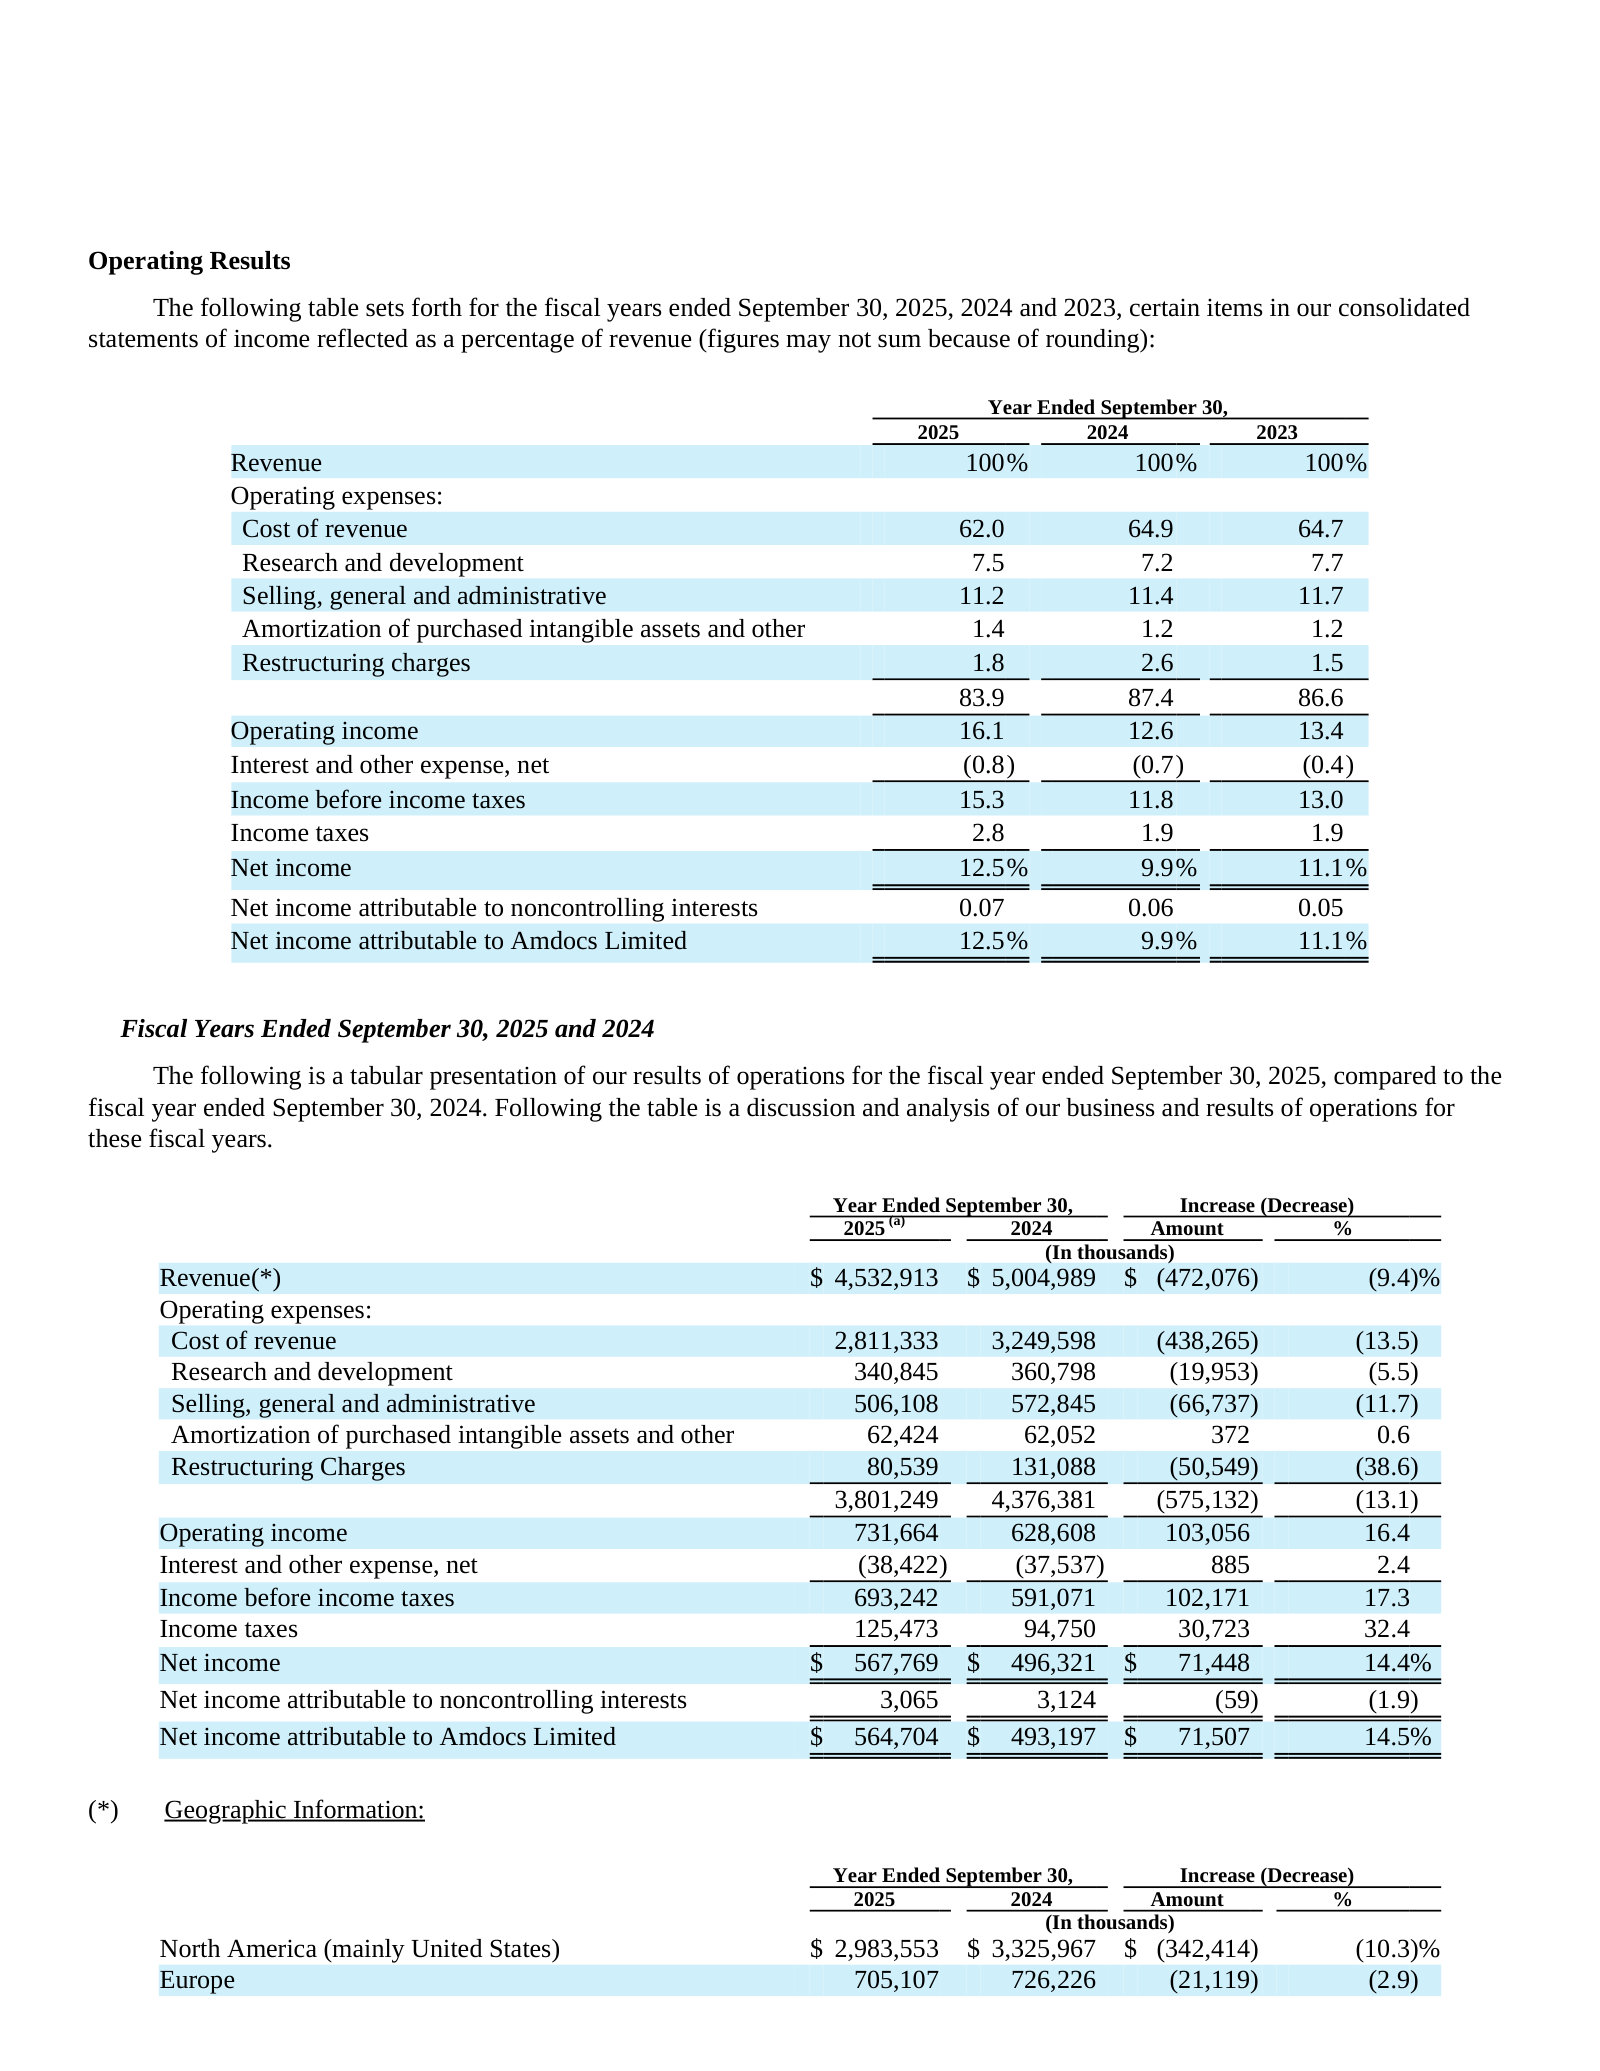
Report of Independent Registered Public Accounting Firm — Critical Audit Matter — p. 127 · Read the full section →
The policy that defines the model: project revenue booked over time on estimated labor effort — the year's sole critical audit matter.
Percentage-of-completion by labor effort — the judgment that drives when project revenue is recognized.
As discussed in Note 2 to the consolidated financial statements, the Company’s software solutions usually require significant customization, modification, implementation and integration. As a result, a significant portion of the Company’s project revenue is recognized over time, based on the percentage that incurred labor effort to date bears to total projected labor effort.
p. 128 · Read in context →
More annual reports
Amdocs Limited — FY2024 Annual Report (Form 20-F) — FY2024 · 128 pages · The pre-reset baseline: $5.0B revenue before the low-margin non-core activities were phased out in FY2025. · Open →
Amdocs Limited — FY2023 Annual Report (Form 20-F) — FY2023 · 168 pages · Captures the TEOCO and ProCom acquisitions that built out the network and digital-services offerings. · Open →
Amdocs Limited — FY2022 Annual Report (Form 20-F) — FY2022 · 122 pages · Earlier view of the cloud-migration and 5G monetization strategy as growth reaccelerated post-pandemic. · Open →
Amdocs Limited — FY2021 Annual Report (Form 20-F) — FY2021 · 121 pages · Oldest edition on file: AT&T at 25% and T-Mobile at 19% of revenue — the concentration starting point. · Open →
Competitors describe Amdocs Limited's market in their own filings and calls. These verified passages and visual pages show where their strategies meet, using source documents preserved in Sources.
CSG Systems International (CSGS)
Amdocs's closest US-listed pure-play in communications BSS — real-time revenue management, digital monetization and customer engagement for the same tier-1 operators. It is the one peer that names Amdocs directly in its 10-K, and in October 2025 it agreed to be acquired by NEC, parent of Netcracker (another named Amdocs rival) — a deal that would consolidate two of Amdocs's stated competitors under one owner.
CSG's Item 1 'Competition' section names Amdocs Limited first among its rivals — grouping Amdocs (with NEC Netcracker) as the 'on-premise bespoke custom' incumbents it competes against in revenue management and digital monetization, while casting itself as the cloud/SaaS challenger. The clearest instance of a peer putting the subject on the page by name.
The market for our offerings is competitive and evolving. We compete with both independent providers and in-house developers of revenue management, digital monetization customer experience, and payments systems. Our current competitors include companies who deliver on-premise bespoke custom offerings (i.e., Amdocs Limited, NEC Netcracker), software solutions (i.e., Salesforce, Adobe, Pegasystems, Twilio), internally developed enterprise applications, network operators (i.e., Ericsson, Huawei), cloud based vendors (i.e., Aria, Zuora, Salesforce), large outsourced transactional communications companies (i.e., Intrado, Genesys), systems integrators (i.e., Accenture, Tech Mahindra), large payments processors (i.e., FIS, Chase Payment Solutions), payments specialists (i.e., Stripe, Square), and niche players (i.e., Paymentus, Invoice Cloud).
p. 8 · Read in context →
CSG's own description of the product overlap with Amdocs: real-time revenue-management and configurable business support systems that monetize the customer lifecycle for Communication Service Providers — the billing, charging and monetization domain Amdocs sells into.
We provide robust, integrated real-time revenue management platforms leveraging public cloud, private cloud, or on premise deployments to optimize and monetize transactions at every stage of the customer lifecycle. Our flexible, configurable business support systems help companies be more profitable because they sell, engage, and monetize better with CSG integrated, domain specific technology. […] For Communication Service Providers ("CSPs"), it provides new revenue sources beyond connectivity, information, and communications services. […] We enable companies to bring new services to market with hyper speed and scale with our revenue management platforms which are key to growing revenue and profits in a digital world.
p. 5 · Read in context →
CSG's customer roster overlaps Amdocs's at the tier-1 level — it lists Verizon, AT&T, Comcast, Charter, América Móvil and Telstra among its CSP customers, the same operator accounts Amdocs serves.
We work with some of the world’s leading brands in a wide variety of industry verticals, including leading CSPs like Charter, Comcast, MTN, Airtel Africa, DISH, Mobily, Verizon, AT&T, American Movil, and Telstra.
p. 7 · Read in context →
Cerillion plc (CER)
A UK-listed pure-play BSS/OSS vendor (billing, charging, CRM) that sells a pre-integrated, product-based SaaS stack to telecom operators as the nimble, standardized alternative to large custom-integration incumbents like Amdocs. It competes in the same Gartner CSP revenue-management and monetization categories, at a fraction of Amdocs's scale.
Cerillion reports a record £47.6m of new orders — headlined by its largest-ever win, onboarding a European operator's newly acquired tier-1 mobile base for £25.3m over five years — plus a new Armenian carrier (Ucom) and a record £275m pipeline: a small rival winning CSP billing estate that incumbents like Amdocs would target.
in the year under review we signed a record value of new orders at £47.6m. This is c.25% higher than the prior financial year and included our most substantial win in the Company’s history to date which was with an existing European customer to on-board its newly acquired tier-1 mobile customer base. This composite deal, agreed in two stages, is worth a total of £25.3m over five years. We also secured a major new customer in Ucom, a leading provider of telecommunications services in Armenia. […] the total, unweighted value of this pipeline stood at £275m (2024: £262m), a new high.
p. 7 · Read in context →
Cerillion's analyst positioning maps directly onto Amdocs's categories: it cites inclusion in Gartner's Market Guides for CSP Revenue Management and Monetization and for CSP Customer Management, and a Major Player rating in IDC's telecom customer-experience MarketScape.
Earlier in the year, Cerillion was also included as a Representative Vendor in the “Gartner Market Guide for CSP Customer Management and Experience Solutions”, published in June, and in March, we were included in the “Gartner Market Guide for CSP Revenue Management and Monetization Solutions”. […] We were also delighted to be named as a Major Player in the “IDC MarketScape: Worldwide Customer Experience Platforms for Telecommunications 2025 Vendor Assessment” (doc # US52580525, August 2025).
p. 9 · Read in context →
Oracle Corporation (ORCL)
Through Oracle Communications and its cloud applications on OCI, Oracle targets the communications vertical and is pulling carrier customer-experience and workload spend onto its own cloud — the platform layer Amdocs increasingly competes for as BSS/OSS migrates to hyperscaler cloud. Oracle is a diversified giant; only the communications and cloud-apps overlap is featured here.
Oracle lists communications among the industries its cloud applications target, and argues its breadth is the differentiator against rivals 'that offer more limited or specialized applications' — the suite-versus-specialist pitch that pressures focused BSS/OSS vendors like Amdocs as CSP software moves to cloud.
In addition, we offer several cloud-based industry solutions to address specific customer needs within certain industries including communications, construction and engineering, education, financial services, government, healthcare, hospitality, utilities and retail, among others. […] We believe that the comprehensiveness and breadth of our cloud applications offerings differentiate us from many of our competitors that offer more limited or specialized applications.
p. 9 · Read in context →
Oracle's own competitor set is the enterprise-software and hyperscaler giants — SAP, Salesforce, Microsoft, Amazon, Alphabet — not telecom-billing specialists, a reminder that Amdocs's cloud/SaaS shift runs into diversified platform companies fighting on a far wider front.
Our enterprise cloud, software and hardware offerings compete directly with certain offerings from some of the largest and most competitive companies in the world, including Adobe Systems Incorporated, Alphabet Inc., Amazon.com, Inc., Cisco Systems, Inc., Intel Corporation, International Business Machines Corporation, Microsoft Corporation, Salesforce, Inc. and SAP SE, as well as other companies like Hewlett-Packard Enterprise and Workday, Inc.
p. 18 · Read in context →
On its Q2 FY2026 call Oracle details telecom wins on OCI, including a five-year TIM Brasil expansion where AI agents 'compare bills for customers across months' and explain variations — customer-care and bill-explanation use cases squarely inside Amdocs's BSS and managed-services turf.
Oracle management, Q2 FY2026 earnings call: In communications, the communications industry, Digital Bridge Holdings selected ERP and SCM. […] TIM Brasil, who is the country's five-g leader, just signed a new five-year expansion to accelerate AI adoption and to transform customer experience at scale, all built on OCI. […] they're now building AI agents that are powering real customer interactions, including the content agent which compares bills for customers across months, and explains variations automatically.
p. 5 · Read in context →
Ericsson (ERIC)
Ericsson's Digital Services / monetization software, its network-API business and Vonage collide with Amdocs's monetization/BSS and network-API offerings to carriers. Its own read on where telecom growth is — and is not — frames the maturity of Amdocs's core CSP market. No Ericsson annual report was available; exhibits are from FY2026 earnings calls.
Ericsson's CEO tells investors that growth 'will come in areas outside of our traditional CSP markets' — enterprise and mission-critical networks — a candid read on the maturity of the carrier market that is Amdocs's core customer base.
Börje Ekholm, President and CEO: We believe the growth will come in areas outside of our traditional CSP markets. And then we’re talking about areas like enterprise and mission critical networks.
p. 3 · Read in context →
Ericsson frames its strategy around exposing network capabilities to developers and capturing 'a greater share of the value from connectivity' — the 5G/network-API monetization layer that overlaps Amdocs's monetization and network-API offerings to operators.
Börje Ekholm, President and CEO: This includes exposing network capabilities through network-powered solutions, allowing developers to use the network capabilities to create new use cases. It also includes opening up new addressable markets such as enterprise solutions based on cellular technology and mission-critical networks. And this will allow us to capture a greater share of the value from connectivity and drive mid-single-digit growth for Ericsson while achieving our long-term margin targets of 15% to 18%.
p. 7 · Read in context →
Ericsson's CEO concedes that Vonage — its communications-platform, network-API and enterprise-monetization asset, the vehicle most directly competing with Amdocs's monetization ambitions — 'has not been contributing' and is a multi-year turnaround.
Börje Ekholm, President and CEO (Q&A): You all know the business of Vonage has not been contributing. We put in place a plan to change the trajectory of that business that we're executing upon. It will take a little bit more time, you will start to see improved performance in the reported numbers. […] Clearly, the ambition is here to turn this around and make it value accreting in the future.
p. 24 · Read in context →
Tech Mahindra (TECHM)
A telecom-heavy IT-services firm whose Communications vertical and Comviva BSS/mobility-software unit compete with Amdocs on network transformation, systems integration and managed services — including the multi-hundred-million-dollar CSP modernization deals Amdocs bids for. This is the services-and-SI side of Amdocs's competition rather than packaged BSS.
Tech Mahindra's MD & CEO on a >$500m, five-year European telco 'mega deal' — a comprehensive applications modernization spanning the CIO and CTO domains — exactly the multi-year CSP transformation engagement Amdocs competes for on the services side.
Mohit Joshi, Managing Director & CEO: This is a strategic engagement with a leading European telco, one of the largest wins in the company's history, with a total contract value exceeding $500 million over five years. This multi-year partnership is about a comprehensive modernization of the client's application across both the CIO and the CTO domains, aimed at accelerating innovation, strengthening digital resilience, and achieving AI-led operational efficiencies enabled by our deep domain expertise and proven transformation capabilities. This win further strengthens our leadership position within the telecom vertical.
p. 3 · Read in context →
Tech Mahindra quantifies its Communications vertical (up 2.6% year-on-year) and calls out Comviva — its telecom BSS and mobility-software unit — growing double digits for a second year, the product line most directly overlapping Amdocs's BSS.
Mohit Joshi, Managing Director & CEO: Within Communications, we grew 2.6% year-on-year. This was led by stabilization and increased spend from our largest US client. Comviva also grew double digits for the second year, adding to the momentum.
p. 4 · Read in context →
Tech Mahindra's telecom offering as it describes it — helping communications providers move 'from delivering connectivity to orchestrating platforms, services, and outcomes,' with a portfolio spanning CX platforms, autonomous networks and 'Ecosystem Platforms and Monetisation' that maps onto Amdocs's BSS/CX and monetization stack.
We help communications providers move beyond traditional networks to unlock new value, integrating technology, ecosystems, and experiences. By transforming networks, IT, and operations into intelligent systems, we enable a shift from delivering connectivity to orchestrating platforms, services, and outcomes across the full spectrum of business, human, and technology ecosystems. […] Agentic CX and EX I Digital Consumer and Experience Platforms I Autonomous Networks I Digital Cloud and Infrastructure I Connected Enterprise I Ecosystem Platforms and Monetisation I AI @ Core
p. 41 · Read in context →
More peer documents
CSG Systems FY2024 Form 10-K — 90 pages · Prior-year 10-K carries the same 'on-premise bespoke custom offerings (i.e., Amdocs Limited, NEC Netcracker)' competitor language (p.7), confirming Amdocs is a durable named rival across consecutive filings. · Open →
CSG Systems Q4 FY2024 earnings call — 11 pages · Management colour on SaaS revenue-management momentum and CSP diversification beyond the concentrated Charter/Comcast base. · Open →
Cerillion plc FY2024 Annual Report — 85 pages · Prior-year report frames Cerillion's 'unrivalled product-based SaaS solution' and its first tier-1 win (Virgin Media Ireland taking billing, charging, fulfilment and product catalogue), the pre-integrated pitch aimed at incumbents like Amdocs. · Open →
Oracle Q4 FY2026 earnings call — 9 pages · Cites a Latin American telecom operator choosing OCI, Field Service applications and Oracle's AI data platform to automate customer service for 30 million subscribers — adjacent to Amdocs's managed-services/CX turf. · Open →
Source: S&P Capital IQ consensus via Xpressfeed · Generated 2026-07-31.
Amdocs' consensus tape reads as a low-drama compounder: mid-single-digit revenue growth feeding double-digit normalized-EPS gains through FY2029 on gradual margin and ROE expansion, all in USD on a September fiscal year. Normalized EPS has beaten consensus in each of the last eight quarters, usually modestly, while revenue prints within roughly a point of the number. The tape's one soft spot is a ~1.7% six-month cut to the FY2028 EPS estimate against flat revenue, and coverage that thins to one or two analysts in FY2028-FY2029.
Revenue grows ~3-5% a year but normalized EPS accelerates to double digits by FY2029
Currency: USD · Scale: money in millions, absolute · YoY uses the prior fiscal year from the feed; analyst count and range use the first displayed period.
| Metric | FY2025A | FY2026E | FY2027E | FY2028E | FY2029E | YoY | Analysts | Low / high |
|---|---|---|---|---|---|---|---|---|
| Revenue | $4.53bn | $4.69bn | $4.85bn | $5.11bn | $5.28bn | — | 5 | $4.52bn / $4.54bn |
| EPS (normalized) | $6.98 | $7.41 | $8.06 | $8.94 | $10.09 | — | 5 | $6.96 / $7.00 |
| Gross margin | 38.5% | 38.5% | 38.6% | 38.9% | 39.8% | — | — | — |
| ROE | 20.7% | 21.3% | 21.6% | 25.0% | 25.7% | — | — | — |
Normalized EPS has beaten consensus eight quarters running, revenue landing within a point
Every one of the last eight quarters cleared the normalized-EPS consensus, mostly by well under 2%; revenue was roughly in line, with only two sub-0.5% misses. The pattern reads as tightly guided rather than a run of blowouts.
Current sequences by metric: Revenue: 5 consecutive beats; EPS (normalized): 8 consecutive beats.
Currency: USD · Scale: money in millions, absolute · Consensus is captured before each actual first became effective.
| Quarter | Metric | Consensus | Actual | Surprise | Outcome |
|---|---|---|---|---|---|
| Q2 FY2026 | Revenue | $1.17bn | $1.17bn | +0.5% | Beat |
| Q2 FY2026 | EPS (normalized) | $1.76 | $1.78 | +0.9% | Beat |
| Q1 FY2026 | Revenue | $1.15bn | $1.16bn | +0.2% | Beat |
| Q1 FY2026 | EPS (normalized) | $1.76 | $1.81 | +3.0% | Beat |
| Q4 FY2025 | Revenue | $1.15bn | $1.15bn | +0.4% | Beat |
| Q4 FY2025 | EPS (normalized) | $1.82 | $1.83 | +0.4% | Beat |
| Q3 FY2025 | Revenue | $1.13bn | $1.14bn | +1.3% | Beat |
| Q3 FY2025 | EPS (normalized) | $1.71 | $1.72 | +0.6% | Beat |
| Q2 FY2025 | Revenue | $1.12bn | $1.13bn | +0.4% | Beat |
| Q2 FY2025 | EPS (normalized) | $1.70 | $1.78 | +4.5% | Beat |
| Q1 FY2025 | Revenue | $1.11bn | $1.11bn | -0.4% | Miss |
| Q1 FY2025 | EPS (normalized) | $1.64 | $1.66 | +1.4% | Beat |
| Q4 FY2024 | Revenue | $1.26bn | $1.26bn | +0.1% | Beat |
| Q4 FY2024 | EPS (normalized) | $1.70 | $1.70 | +0.1% | Beat |
| Q3 FY2024 | Revenue | $1.25bn | $1.25bn | -0.4% | Miss |
| Q3 FY2024 | EPS (normalized) | $1.60 | $1.62 | +1.4% | Beat |
FY2028 EPS estimate trimmed ~1.7% over six months while revenue sits flat
FY2027 estimates are essentially frozen over six months, while FY2028 normalized EPS slipped from 9.10 to 8.94 (about -1.7%) even as FY2028 revenue barely moved - consistent with a margin-side markdown rather than a revenue cut.
Currency: USD · Scale: money in millions, absolute · Point-in-time consensus; Δ90d is Now versus 90d.
| Metric | FY | 180d | 90d | 30d | Now | Δ90d |
|---|---|---|---|---|---|---|
| EPS (normalized) | FY2027 | $8.10 | $8.11 | $8.06 | $8.06 | -0.5% |
| EPS (normalized) | FY2028 | $9.10 | $8.88 | $8.94 | $8.94 | +0.6% |
| Revenue | FY2027 | $4.87bn | $4.85bn | $4.85bn | $4.85bn | -0.1% |
| Revenue | FY2028 | $5.13bn | $5.11bn | $5.11bn | $5.11bn | +0.0% |
Analysts span ~15% on FY2027 EBITDA even as EPS and revenue stay tightly clustered
On FY2027 EBITDA the four estimates run from 1,110 to 1,290 (mean 1,213); GAAP net income is nearly as split across three analysts. Normalized EPS and revenue, by contrast, are tightly clustered.
Currency: USD · Scale: money in millions, absolute · Spread/mean is absolute high-low divided by absolute mean.
| Metric | Period | Mean | Low–high | Spread/mean | Analysts |
|---|---|---|---|---|---|
| EBITDA | FY2027E | $1.21bn | $1.11bn–$1.29bn | 14.8% | 4 |
| Net income (GAAP) | FY2027E | $661.72m | $627.91m–$710.08m | 12.4% | 3 |
Ratings split 3 buy / 3 hold; targets stretch $70.84 to $105 on four marks
Ratings are evenly split 3 buy / 3 hold with no sells, and the four price targets run $70.84 to $105 around an $81.21 mean - the $105 high pulls the mean well above the $74.50 median.
Currency: USD · Scale: money in millions, absolute · Analyst counts shown explicitly.
| Street view | Reading | Analysts |
|---|---|---|
| Recommendation mix | Buy 3, Outperform 0, Hold 3, Underperform 0, Sell 0 | 6 |
| Consensus score | 2.00 | 6 |
| Target price | mean $81.21; median $74.50; high $105.0; low $70.84 | 4 |
Coverage thins to two analysts by FY2028 and one by FY2029
Consensus is robust through the current year (FY2026 revenue has six analysts, EPS five) but degrades fast: FY2028 rests on two estimates and FY2029 on a single one, so the outer-year growth curve is more one house's view than a true consensus.
Visible Alpha broker models via S&P Xpressfeed · 5 brokers · 310 line items · freshest revision 2026-06-29.
The broker models cast Amdocs as a low-growth, high-conversion compounder. After a roughly 9.5% revenue reset in FY2025 (a divestiture), the street has the top line reaccelerating to only about 3-4% a year, yet non-GAAP diluted EPS compounding from $7.00 toward $9.00 by FY2028 on steady operating-margin gains and buybacks. Coverage is thin: no line carries more than five brokers, and the differentiated segment detail rests on just two.
Operating EPS climbs from $7.00 to $9.00 by FY2028 while revenue grows just 3-4% a year
Revenue reaccelerates off the FY2025 reset, but each layer down the model grows faster than the one above it — operating income outpaces revenue and operating margin ticks up steadily through FY2028, so EPS does the real compounding.
| Line | FY-2025A | FY-2026E | FY-2027E | FY-2028E | YoY | Brokers |
|---|---|---|---|---|---|---|
| Revenue | $4.53bn | $4.69bn | $4.85bn | $5.02bn | +3.7% | 5 |
| Operating income/(loss) - Operating | $968.64m | $1.01bn | $1.06bn | $1.11bn | +4.6% | 5 |
| Operating margin(%) | 21.4% | 21.6% | 21.8% | 22.1% | +0.2pt | 5 |
| EPS - Diluted - Operating($) | $7.00 | $7.44 | $8.09 | $9.00 | +6.2% | 5 |
Growth leans international: RoW and Europe outpace a slowing North America as the managed-services base flattens
Managed services — about two-thirds of revenue — is the recurring ballast, but the models have it essentially flat by FY2028. Net growth increasingly rides Rest-of-world and Europe while North America's share erodes. All four lines rest on only two to three brokers.
| Line | FY-2025A | FY-2026E | FY-2027E | FY-2028E | YoY | Brokers |
|---|---|---|---|---|---|---|
| Recurring | — | — | — | — | — | — |
| Revenue - Managed services | $3.01bn | $3.06bn | $3.14bn | $3.14bn | +1.5% | 3 |
| Geography | — | — | — | — | — | — |
| Revenue - North America | $2.97bn | $3.06bn | $3.15bn | $3.28bn | +2.9% | 2 |
| Revenue - Europe | $703.82m | $756.39m | $786.21m | $818.46m | +7.5% | 2 |
| Revenue - Rest of the world | $850.86m | $885.83m | $934.05m | $983.99m | +4.1% | 2 |
Free cash flow dips in FY2026 then reaccelerates — FCF margin troughs near 14.5% before recovering to ~16.6%
The models show a one-year cash-conversion dip in FY2026 before FCF outgrows earnings into FY2028, lifting the FCF margin above its FY2025 level. This is the best-covered differentiated line, at five brokers.
| Line | FY-2025A | FY-2026E | FY-2027E | FY-2028E | YoY | Brokers |
|---|---|---|---|---|---|---|
| Net cash provided by (used in) operating activities | $789.60m | $792.60m | $867.40m | $972.53m | +0.4% | 5 |
| Free Cash Flow | $693.24m | $678.96m | $744.87m | $835.22m | -2.1% | 5 |
| FCF margin(%) | 15.3% | 14.5% | 15.4% | 16.6% | -0.8pt | 5 |
Where brokers actually split: FY2027 free cash flow and FY2028 operating EPS
Consensus on near-term revenue is tight; the real dispute is on how much cash and out-year EPS the model throws off.
| Line | Period | Median | Q1–Q3 | Min–max | Brokers |
|---|---|---|---|---|---|
| Free Cash Flow | FY-2027E | $750.17m | $740.00m–$762.29m | $664.32m–$807.59m | 5 |
| EPS - Diluted - Operating($) | FY-2028E | $9.07 | $8.87–$9.21 | $8.54–$9.32 | 4 |
Thin, uneven coverage — five brokers at most, segments on two
No line exceeds five brokers; geographic and managed-services detail rests on two to three, and a 12-month backlog line (single broker) was excluded. Headline P&L and FCF were revised late June 2026, but segment lines were last touched in May 2026 or August 2025. Treat the wide EBITDA-margin dispersion as a definitional artifact, not a real debate.
Headline P&L consensus, momentum and beat/miss live in the CapIQ tab.
Source: S&P Capital IQ transcripts via Xpressfeed · latest indexed call 2026-05-13 · generated 2026-07-31.
Latest call digest
Amdocs Limited, Q2 2026 Earnings Call, May 13, 2026 · 2026-05-13T21:00:00
Q2 FY2026 call (May 13, 2026) was the first led by new CEO Shimie Hortig, who framed Amdocs' future around an "agentic era" vision built on aOS, the agentic operating system launched at Mobile World Congress. Reported results were solid and above the midpoint: revenue of $1.17 billion, non-GAAP diluted EPS of $1.78, a record $192 million quarter in Europe and 12-month backlog of $4.28 billion. Prepared remarks leaned on strategy and a second leadership change — the retirement of long-time CFO Tamar Rapaport-Dagim and the appointment of Tal Rosenfeld — while reiterating full-year fiscal 2026 guidance (roughly 3% constant-currency revenue growth and roughly 6% non-GAAP EPS growth). Q&A was noticeably more skeptical than the prepared script: analysts pressed on whether Amdocs can capture the broader AI and data-center spending wave, when aOS actually contributes revenue, and why US carriers appear to be adopting AI faster than Amdocs' measured narrative suggests. On timing, management conceded aOS is not yet meaningful this fiscal year. The gap between an ambitious agentic vision and a still-modest near-term financial contribution was the call's central tension.
Participant coverage from the latest call.
| Group | Participants | Count |
|---|---|---|
| Management | Operator; Matthew Smith — Secretary & Head of Investor Relations, Amdocs Limited; Shimie Hortig — President, CEO & Director, Amdocs Limited; Tamar Dagim — Former CFO & COO, Amdocs Limited; Tal Rosenfeld | 5 |
| Analysts | Tal Liani — MD, Head of Technology Supersector & Senior Analyst, BofA Securities, Research Division; Timothy Horan — MD & Senior Analyst, Oppenheimer & Co. Inc., Research Division; Taran Katta — Associate, Wolfe Research, LLC | 3 |
Curated latest-call exchanges; one row per analyst topic.
| Analyst | Firm | Topic | What changed in Q&A |
|---|---|---|---|
| Tal Liani | BofA Securities, Research Division | Participating in the AI/data-center capex cycle | Asked whether Amdocs can benefit from surging data-center and AI infrastructure spend; Hortig reframed it as the agentic-transformation opportunity for carriers rather than direct infrastructure exposure. |
| Tal Liani | BofA Securities, Research Division | New CEO priorities and timing to impact growth | Pressed on what Hortig would change in his first months and how long before it shows in growth; the answer centered on accelerating the agentic portfolio, tailored customer road maps and an internal GenAI-native transformation, without committing to a timeline. |
| Tal Liani | BofA Securities, Research Division | CFO succession plan | Asked for detail on the CFO transition; Dagim endorsed Tal Rosenfeld's revenue-recognition and finance background and described a thorough internal succession process. |
| Timothy Horan | Oppenheimer & Co. Inc., Research Division | aOS pipeline and when it moves revenue | Asked when aOS starts to move the needle; management said early deals are small and nothing meaningful is embedded in fiscal 2026, but expects them to grow over time. |
| Timothy Horan | Oppenheimer & Co. Inc., Research Division | US carriers' faster AI adoption and competitive risk | Noted US telcos touting aggressive AI-driven cost cuts and asked whether they use Amdocs or others; Hortig argued mission-critical agentic transformation is being discussed with Amdocs, not competitors. |
| Taran Katta | Wolfe Research, LLC | Internal AI efficiencies and customer conversations | Asked about new internal AI use cases and how customer dialogue is progressing; management described moving from pilots to full implementation and expanding into end-to-end workflow scope. |
Theme tracker
Themes are curator-classified across supplied calls.
| Theme | Status | Quarters mentioned | Read-through |
|---|---|---|---|
| Generative AI shifting to an agentic platform (amAIz to Cognitive Core to aOS) | persisted | Q3 2023, Q4 2023, Q1 2024, Q2 2024, Q3 2024, Q4 2024, Q1 2025, Q2 2025, Q3 2025, Q4 2025, Q1 2026, Q2 2026 | On every call in the window. The framing evolved from telco-taxonomy 'amAIz' and dozens of POCs, to converting POCs into commercial deals in FY2025, to the aOS agentic operating system now positioned as the primary future growth engine. Throughout, management placed the meaningful revenue benefit in future quarters rather than the current year. |
| Cloud as the proven double-digit growth engine (over 30% of revenue) | persisted | Q3 2023, Q4 2023, Q1 2024, Q2 2024, Q3 2024, Q4 2024, Q1 2025, Q2 2025, Q3 2025, Q4 2025, Q1 2026 | Cloud was repeatedly cited as the one reliable growth engine, passing 20% of revenue in FY2023 and exceeding 30% in FY2025. Its prominence receded on the Q2 2026 call as the agentic narrative took over the strategy discussion. |
| Legacy-system enhancement spending headwind (~3%) | dropped | Q3 2023, Q4 2023, Q1 2024, Q2 2024 | A recurring ~3% revenue headwind from carriers deprioritizing legacy-system enhancements in favor of modernization dominated FY2023 and early-FY2024 commentary, then dropped out of the narrative from Q3 2024 onward as the noncore phaseout and general macro framing replaced it. |
| Phaseout of ~$600M low-margin noncore activities (pro forma comparisons) | dropped | Q4 2024, Q1 2025, Q2 2025, Q3 2025, Q4 2025 | Introduced Q4 2024 to sharpen focus and lift non-GAAP operating margin above 21%, and used as the pro forma comparison base throughout FY2025. It is no longer referenced in the FY2026 calls now that the comparison has lapped. |
| T-Mobile revenue decline from reduced discretionary spending | emerged | Q4 2025, Q1 2026 | Flagged as a fiscal 2026 headwind at Q4 2025 and reaffirmed alongside the new 5-year renewal at Q1 2026. It was not revisited in the Q2 2026 prepared remarks. |
| Leadership transition (CEO then CFO) | emerged | Q1 2026, Q2 2026 | CEO Shuky Sheffer's retirement and Shimie Hortig's succession (effective March 31, 2026) were announced at Q1 2026; CFO Tamar Rapaport-Dagim's retirement and Tal Rosenfeld's appointment were announced at Q2 2026. |
| Managed services resilience (~two-thirds of revenue, near-100% renewal) | persisted | Q3 2023, Q4 2023, Q1 2024, Q2 2024, Q3 2024, Q4 2024, Q1 2025, Q2 2025, Q3 2025, Q4 2025, Q1 2026, Q2 2026 | Every call reiterates managed services at roughly 58% early in the window rising to 65-66% of revenue, with renewal rates approaching 100%. It is consistently positioned as the visibility and resilience anchor beneath slow top-line growth. |
| Roughly half of annual growth expected to be inorganic (M&A) | persisted | Q4 2023, Q4 2024, Q1 2025, Q4 2025, Q1 2026, Q2 2026 | M&A was repeatedly framed as about half of expected growth, from TEOCO, Astadia and Profinit to MATRIXX Software ($197M) and Connect44 — a persistent reliance on acquisitions to supplement organic growth. |
Guidance ledger
Quotes, calls, and speakers are source-verified; outcomes are curator-classified.
| Verbatim guidance | Call | Speaker | Curator outcome | Outcome note |
|---|---|---|---|---|
| “we expect pro forma revenue growth of between 1% to 4.5% in constant currency in fiscal 2025, including another year of double-digit growth in cloud.” | Amdocs Limited, Q4 2024 Earnings Call, Nov 12, 2024 · 2024-11-12T22:00:00 | Joshua Sheffer | kept | FY2025 pro forma constant-currency revenue rose 3.1%, within the guided range. |
| “we expect our non-GAAP operating margin to surpass 21% for the first time in fiscal 2025” | Amdocs Limited, Q4 2024 Earnings Call, Nov 12, 2024 · 2024-11-12T22:00:00 | Joshua Sheffer | kept | Non-GAAP operating margin ran above 21% through fiscal 2025 (21.6% in Q4 2025). |
| “we now expect non-GAAP diluted earnings per share growth within a tighter range of 8% and 9% for the full fiscal year 2025.” | Amdocs Limited, Q3 2025 Earnings Call, Aug 06, 2025 · 2025-08-06T21:00:00 | Tamar Dagim | kept | FY2025 non-GAAP diluted EPS growth was reported at 8.5%. |
| “We expect revenue growth in the range of 1.7% to 5.7% as reported and 1.0% to 5.0% in constant currency for the full year fiscal 2026.” | Amdocs Limited, Q4 2025 Earnings Call, Nov 11, 2025 · 2025-11-11T22:00:00 | Joshua Sheffer | pending | Reaffirmed at Q1 2026; midpoint held at 3% constant currency and range tightened to 2%-4% by Q2 2026. |
| “we expect free cash flow of between $710 million to $730 million, not including additional payments we expect to make under our current restructuring program.” | Amdocs Limited, Q4 2025 Earnings Call, Nov 11, 2025 · 2025-11-11T22:00:00 | Tamar Dagim | pending | Reiterated through Q2 2026, at which point nearly 50% of the target was reported achieved year-to-date. |
| “We are reiterating our outlook for non-GAAP diluted earnings per share growth of 4% to 8% in fiscal 2026” | Amdocs Limited, Q1 2026 Earnings Call, Feb 03, 2026 · 2026-02-03T22:00:00 | Tamar Dagim | pending | Range tightened to 5%-7% at Q2 2026 with the ~6% midpoint unchanged. |
| “We are reiterating the midpoint of our revenue growth guidance of 3% in constant currency for the full year fiscal 2026, which is within tightened range of 2% to 4%.” | Amdocs Limited, Q2 2026 Earnings Call, May 13, 2026 · 2026-05-13T21:00:00 | Shimie Hortig | pending | Full fiscal year 2026 still in progress as of the May 13, 2026 call. |
| “we are reiterating the midpoint of our guidance for non-GAAP diluted earnings per share growth of roughly 6% in fiscal 2026 which is within a tightened range of 5% to 7% as compared to 4% to 8% previously.” | Amdocs Limited, Q2 2026 Earnings Call, May 13, 2026 · 2026-05-13T21:00:00 | Tamar Dagim | pending | Full fiscal year 2026 still in progress as of the May 13, 2026 call. |
Q&A pressure map
Question counts and firms are curator tallies; analyst coverage shown above.
| Topic | Questions | Firms | Pressure / response |
|---|---|---|---|
| When generative AI / aOS actually contributes to revenue | 12 | Oppenheimer & Co. Inc., Research Division, Stifel, Nicolaus & Company, Incorporated, Research Division, Wolfe Research, LLC, BofA Securities, Research Division, Jefferies LLC, Research Division, Robert W. Baird & Co. Incorporated, Research Division, Citigroup Inc., Research Division | The most persistent line of questioning across the window: analysts repeatedly asked when POCs convert to material revenue and when aOS moves the needle. Management consistently answered that the opportunity is large but the meaningful revenue is future-dated, conceding at Q2 2026 that nothing meaningful was embedded in fiscal 2026 yet. |
| Whether growth can accelerate above the low-single-digit range | 6 | BofA Securities, Research Division, Stifel, Nicolaus & Company, Incorporated, Research Division, Oppenheimer & Co. Inc., Research Division | Tal Liani in particular pressed on why constant-currency growth stays near 3% even after exiting low-margin businesses. Management pointed to cloud plus needing 'more than one growth engine' and to a stronger second half, without committing to a higher structural rate. |
| Macro environment and legacy-enhancement spending | 5 | Jefferies LLC, Research Division, Oppenheimer & Co. Inc., Research Division, Barclays Bank PLC, Research Division, Stifel, Nicolaus & Company, Incorporated, Research Division, Citigroup Inc., Research Division | Recurring questions on whether the demand environment is deteriorating or recovering; management repeatedly characterized it as 'the same' elevated uncertainty with slow pipeline-to-deal conversion but no project cancellations. |
| T-Mobile renewal scope and the expected revenue decline | 4 | Stifel, Nicolaus & Company, Incorporated, Research Division, BofA Securities, Research Division | Analysts probed whether the T-Mobile decline reflects a completed project or ongoing budget cuts. Management declined to discuss the specific program on a single-customer basis, saying only that reasonable assumptions were built into guidance — a case where the direct question was not fully answered. |
| Mechanics and margin impact of the noncore phaseout | 4 | Oppenheimer & Co. Inc., Research Division, Stifel, Nicolaus & Company, Incorporated, Research Division, BofA Securities, Research Division, Citigroup Inc., Research Division | At Q4 2024 analysts pressed on how integrated the phased-out lines were, whether they would be sold, and how much of the margin jump was structural versus mix. Management said the activities were barely accretive and largely standalone, and would be ceased rather than sold. |
Language shifts
Only language evidence verified against the referenced component is shown.
| Observation | Verbatim evidence | Call ID | Component |
|---|---|---|---|
| At Q2 2025, management sharpened its macro caution as tariff-era uncertainty rose, while stressing insulation via the business model. | “The level of global macroeconomic uncertainty is clearly rising in recent months, but we believe Amdocs is relatively well positioned to navigate the present environment due to our unique business model.” | 1941581923 | 2 |
| By Q4 2025 the AI language shifted from experimentation to confirmed commercial traction, marking a step-up in confidence. | “this year, I'm proud to say we made a successful transition from proof-of-concept trials to winning actual generative AI-related deals.” | 1969513883 | 2 |
| Also at Q4 2025, management introduced unusually direct caution about a specific large customer, T-Mobile. | “we do see the pressure of lower discretionary spending in T-Mobile, and this is why we feel we want to be absolutely transparent about the decline we expect there.” | 1969513883 | 18 |
| The new CEO's Q2 2026 language is markedly more assertive about Amdocs' positioning in the 'agentic' opportunity than prior GenAI framing. | “I strongly believe that Amdocs is in the best position to lead our customers and turn this agentic opportunity into reality.” | 1995197694 | 2 |
| Even under new leadership, the standing caution on customer spending persisted verbatim in tone into Q2 2026. | “we are, of course, closely monitoring customer demand and spending behavior within the current global macroeconomic climate.” | 1995197694 | 2 |
The call history shows a company that has promised for years that generative AI would become a new growth engine 'over time' while reported growth has stayed in the low-single digits and one major customer, T-Mobile, has turned into a headwind. The agentic pivot, aOS and a fresh CEO give the story new framing, but management again placed the meaningful revenue several quarters out, so the open question is whether the new platform can lift growth above the roughly 3% that cloud alone has been sustaining.